- Analytics
- Market Overview
US Dollar Index in “Flag” Trading Pattern, USDJPY Eases - 19.11.2013

News

META Lost $119 Billion in a Day
Structural bearish pressure is building up; two verdicts confirm the product defect legal theory and now we have a replicable...
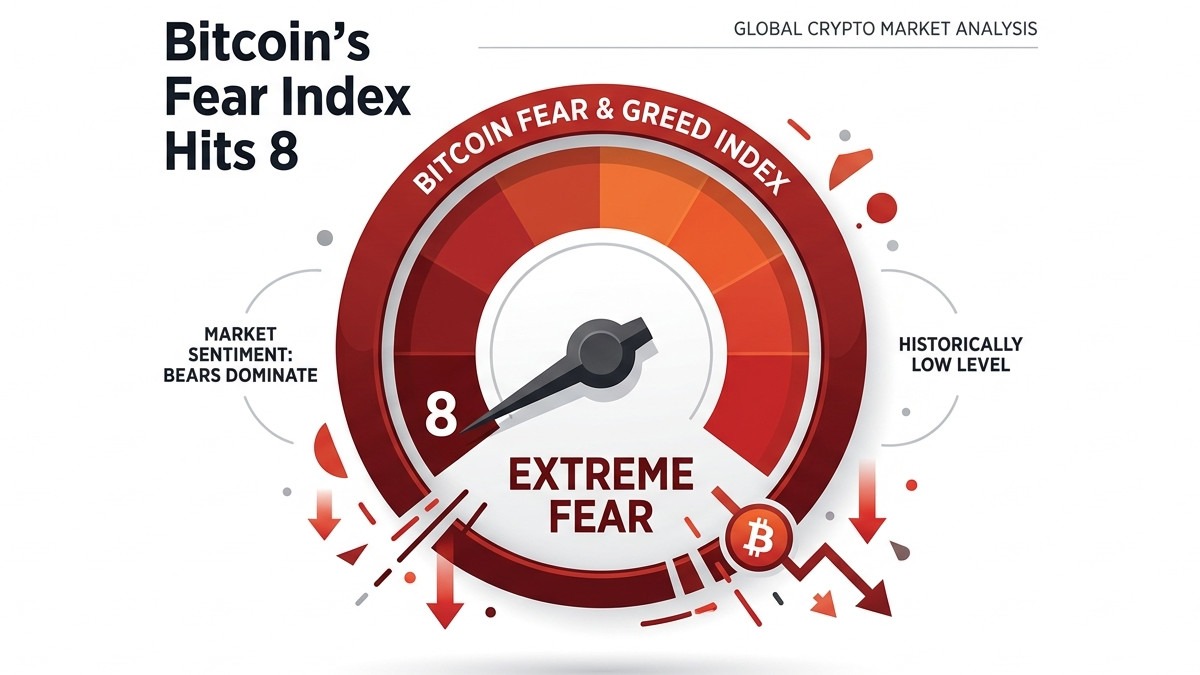
Bitcoin at $67K: Key Levels, Technicals and What's Driving the Price
Bitcoin is in a later stage of post-halving cycle, meaning prices peak and start pulling back. Big institutional buyers are...

Meta Analysis: Not Addiction
The lawsuit against Meta in California is a battle over semantics, design, and liability. Inside the company, employees have...

From ChatGPT to the Department of War
This situation is a classic example of corporate chess. By early 2026, OpenAI was in trouble. They were spending $17 billion...

NVIDIA $117 Billion Trap
Behind Nvidia record breaking revenue there is a catastrophic threat. There is a dangerous dependence on the supply chain...

Private Market in 2026: Blue Owl Capital
In the past few months Blue Owl Capital stock prices fell impressively - 40%. Blue Owl is dealing with big issues - they...
Explore our
Trading Conditions
- Spreads from 0.0 pip
- 30,000+ Trading Instruments
- Stop Out Level - Only 10%
Ready to Trade?
Open AccountSee Also