- Analytics
- Technical Analysis
Retrospective of Technical Analysis AUDUSD From 2016-11-17
Employment change in Australia falls short of expectations

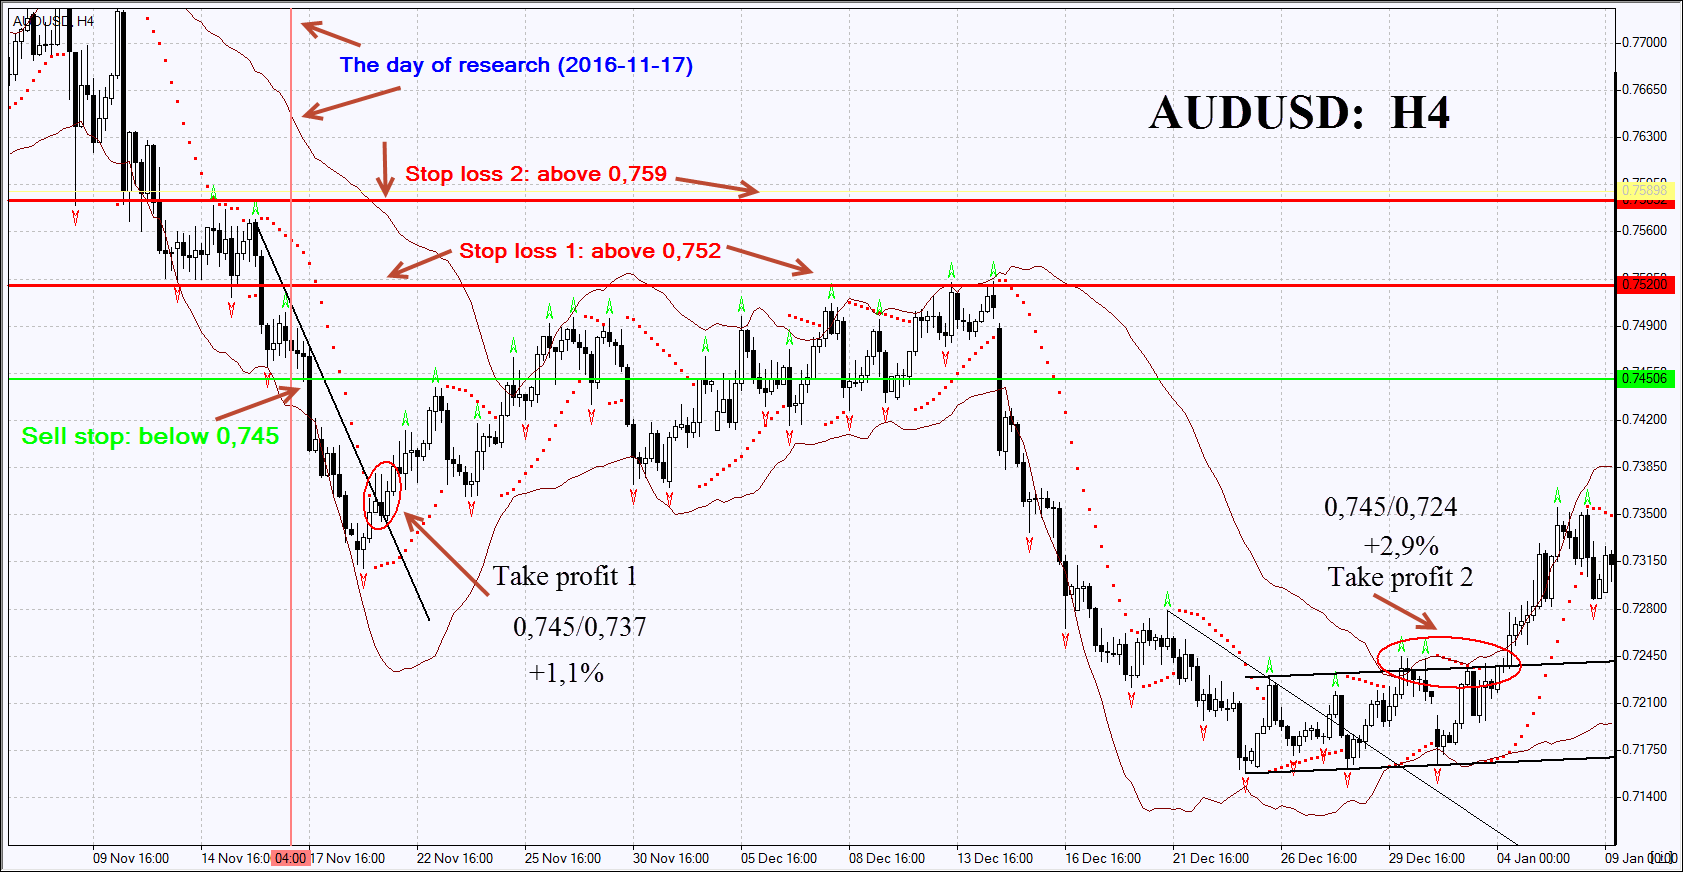
| Sell stop | 0,745 |
| Take profit | 0,737 and 0,724 |
| Return on Investment | +1,1 and +2,9% |
| Overview date | 2016-11-17 |
| Date of the closing position | 2016-11-21 and 2017-01-04 |
The chart shows the real change of quotations after the publication of technical analysis on 2016-11-17. The pending order from this analysis was executed and the position was opened. Next, we shall move the stop to the next fractal low following the Bollinger Bands and Parabolic SAR signals at the 4-hour charts. Thus, we are changing the potential profit/loss to the breakeven point. The position shall be closed when the price meets the Bollinger bands, the Parabolic SAR, the trend line and the fractal indicator.
The chart shows the real change of quotations after the publication of technical analysis on 2016-11-17. The pending order from this analysis was executed and the position was opened. Next, we shall move the stop to the next fractal low following the Bollinger Bands and Parabolic SAR signals at the 4-hour charts. Thus, we are changing the potential profit/loss to the breakeven point. The position shall be closed when the price meets the Bollinger bands, the Parabolic SAR, the trend line and the fractal indicator.
New Exclusive Analytical Tool
Any date range - from 1 day to 1 year
Any Trading Group - Forex, Stocks, Indices, etc.
