- Analytics
- Technical Analysis
Hang Seng Index Technical Analysis - Hang Seng Index Trading: 2018-03-26
US plans to increase import duties on Chinese goods
US President Donald Trump signed a trade memorandum aimed at reducing the trade deficit with China. It implies a reduction in imports of Chinese goods to the United States. Will the Hong Kong’s Hang Seng Index fall?
The trade deficit means that China sells more of its goods in the US than the US – in China. According to various estimates, the excess is between $375 billion and $504 billion per year. Donald Trump is going to correct the current situation by imposing high import tariffs. He has already asked the Chinese authorities to reduce the trade deficit by $100 billion a year. The initial tariffs will affect Chinese goods totaling $60 billion. Their list can be published within 15 days. In addition, Trump instructed the US Treasury to develop rules to limit Chinese investment in the US in order to preserve American intellectual property. Chinese authorities announced possible retaliatory measures against the United States. Currently, they are considering the option of imposing tariffs on US goods worth $3 billion a year. Theoretically, such a trade war can have a negative impact on the stocks of Hong Kong and Chinese companies. On Thursday, the Hang Seng index showed a maximum daily decline in 6 weeks. For 2018 it is up 1.3%, and the S&P 500 - down 1.7%.
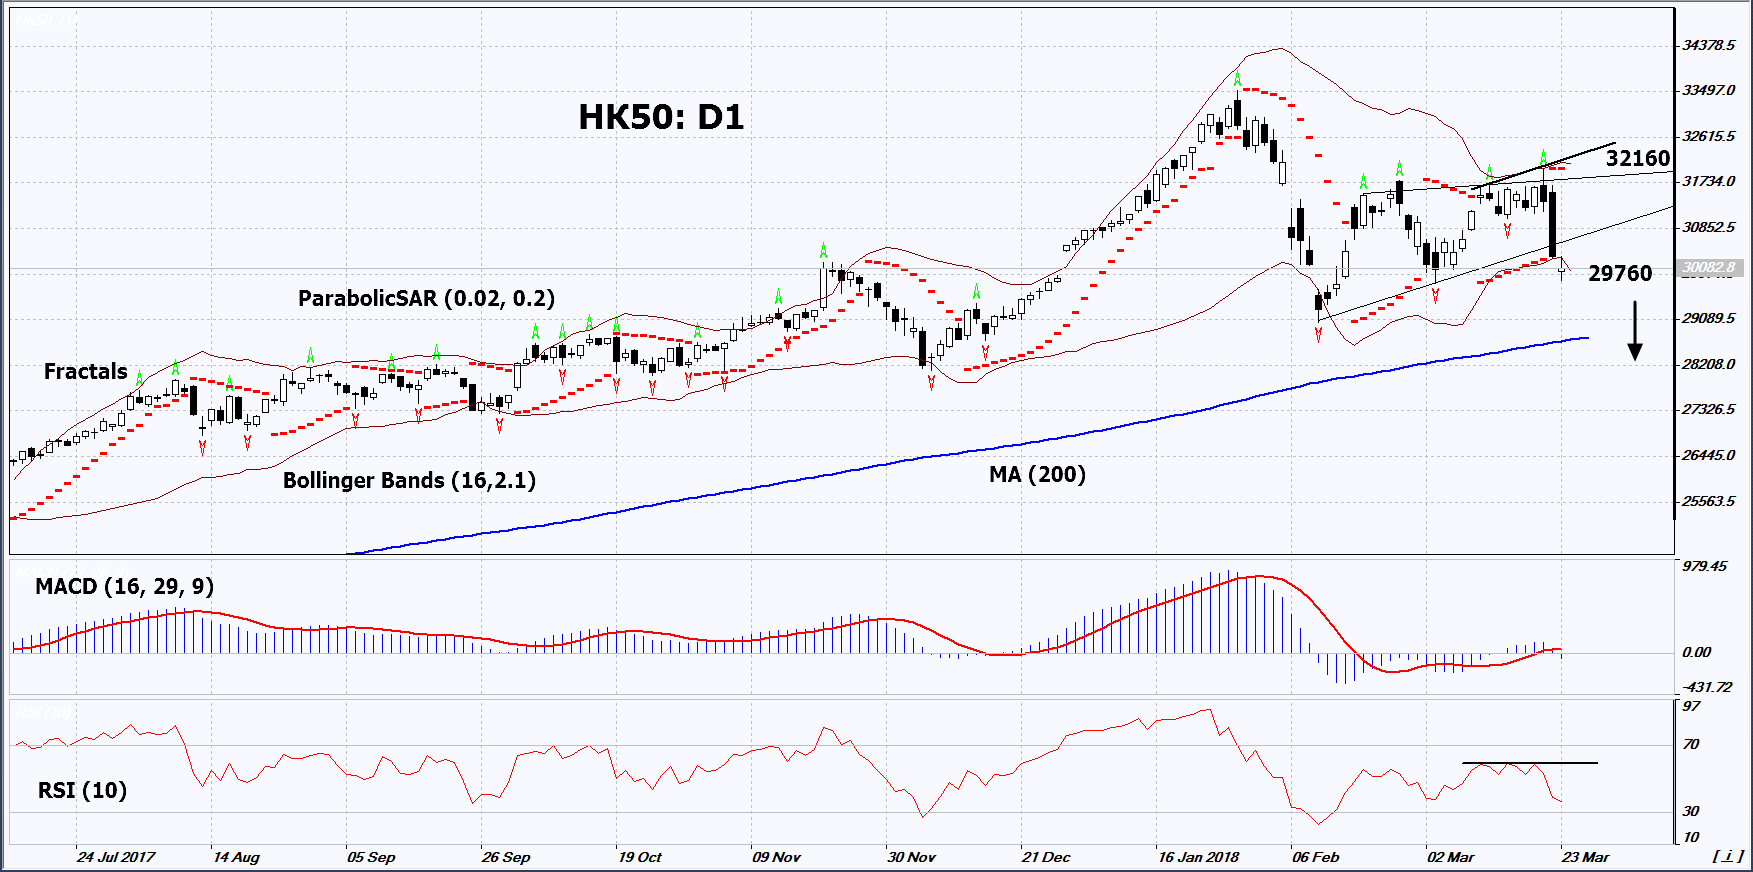
On the daily timeframe, НК50: D1 has left the triangle. The further price decrease is possible in case of the further tightening of exports of Chinese goods to the US and worsening of corporate reports.
- The Parabolic indicator gives a bearish signal.
- The Bollinger bands have strongly narrowed, which indicates low volatility. They are tilted down.
- The RSI indicator is below 50. It has formed a negative divergence.
- The MACD indicator gives a bearish signal.
The bearish momentum may develop in case HK50 falls below its last fractal low at 29760. This level may serve as an entry point. The initial stop loss may be placed above the last fractal high, the upper Bollinger band and the Parabolic signal at 32160. After opening the pending order, we shall move the stop to the next fractal high following the Bollinger and Parabolic signals. Thus, we are changing the potential profit/loss to the breakeven point. More risk-averse traders may switch to the 4-hour chart after the trade and place there a stop loss moving it in the direction of the trade. If the price meets the stop level at 32160 without reaching the order at 29760, we recommend cancelling the position: the market sustains internal changes that were not taken into account.
Summary of technical analysis
| Position | Sell |
| Sell stop | Below 29760 |
| Stop loss | Above 32160 |
- Get Certificate

Note:
This overview has an informative and tutorial character and is published for free. All the data, included in the overview, are received from public sources, recognized as more or less reliable. Moreover, there is no guarantee that the indicated information is full and precise. Overviews are not updated. The whole information in each overview, including opinion, indicators, charts and anything else, is provided only for familiarization purposes and is not financial advice or а recommendation. The whole text and its any part, as well as the charts cannot be considered as an offer to make a deal with any asset. IFC Markets and its employees under any circumstances are not liable for any action taken by someone else during or after reading the overview.
