- Analytics
- Technical Analysis
AUD USD Technical Analysis - AUD USD Trading: 2017-09-06
Improving growth bullish for Australian dollar
The Australian economy accelerates. Will the Australian dollar continue strengthening?
The Reserve Bank of Australia (RBA) held the interest rate at record low 1.5% at its September 5 policy meeting. While inflation is low and wage growth stagnant the central bank expects the economy will continue growing helped by rising commodity prices. Today second quarter GDP was released and growth accelerated to 0.8% over quarter from 0.3% in the first three months. Recent economic data were mixed: unemployment rate fell to 5.6% in July from 5.7% in June. And the business confidence index by the National Australia Bank (NAB) rose to 12 points in July, up from the 9 points in March. Consumer confidence slipped in August. At the same time retail sales in June slowed to 0.3% on month, less than the 0.6% growth in May. Accelerating economy will contribute to Australian dollar’s strength.
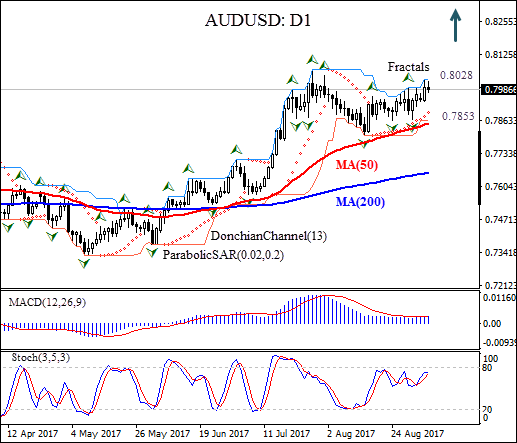
On the daily timeframe AUDUSD: D1 is retracing higher after hitting nine-month low in the beginning of May. The price has risen above the 200-day and 50-day moving averages MA(200) and MA(50), both rising.
- The Donchian channel indicates no trend yet: it is flat.
- The Parabolic indicator has formed a buy signal.
- The MACD indicator is above the signal line and the gap is widening, which is a bullish signal.
- The stochastic oscillator is rising but hasn’t reached the overbought zone yet.
We believe the bullish momentum will continue after the price closes above the upper boundary of Donchian channel at 0.8028, confirmed also by fractal high. This level can be used as an entry point for placing a pending order to buy. The stop loss can be placed below the Parabolic signal at 0.7853. After placing the order, the stop loss is to be moved every day to the next fractal low, following Parabolic signals. Thus, we are changing the probable profit/loss ratio to the breakeven point. If the price meets the stop loss level (0.7853) without reaching the order (0.8028), we recommend cancelling the position: the market has undergone internal changes which were not taken into account.
Technical Analysis Summary
| Position | Buy |
| Buy stop | Above 0.8028 |
| Stop loss | Below 0.7853 |
Explore our
Trading Conditions
- Spreads from 0.0 pip
- 30,000+ Trading Instruments
- Stop Out Level - Only 10%
Ready to Trade?
Open Account Note:
This overview has an informative and tutorial character and is published for free. All the data, included in the overview, are received from public sources, recognized as more or less reliable. Moreover, there is no guarantee that the indicated information is full and precise. Overviews are not updated. The whole information in each overview, including opinion, indicators, charts and anything else, is provided only for familiarization purposes and is not financial advice or а recommendation. The whole text and its any part, as well as the charts cannot be considered as an offer to make a deal with any asset. IFC Markets and its employees under any circumstances are not liable for any action taken by someone else during or after reading the overview.
