- Analytics
- Technical Analysis
XAUUSD Technical Analysis - XAUUSD Trading: 2019-08-01
Diminished Fed easing expectations bearish for XAUUSD
Federal Reserve indicated a 25 basis point rate cut yesterday was not the start of a lengthy easing cycle. Will the XAUSUSD continue retracing lower?
Central banks continuing purchases of gold are a major support for gold prices. Russia’s central bank led gold purchases by central banks in 2018, acquiring 274.3 metric tons to reduce reliance on the U.S. dollar. Other big buyers included Turkey, Kazakhstan, India, Iraq, Poland, and Hungary. In first-quarter this year gold purchases by central banks, led by Russia and China, were the highest in six years as countries diversify their assets away from the U.S. dollar. Global gold reserves rose 145.5 tons in Q1, a 68 percent increase from a year earlier, according to World Gold Council. Central banks bought 651.5 tons in 2018, versus 375 tons in 2017. That’s the largest net purchase of gold since 1967. However as the Federal Reserve cut interest rates on July 31, 2019 for the first time in ten years, Fed Chairman Jerome Powell said “It’s not the beginning of a long series of rate cuts,” while adding “I didn’t say it’s just one rate cut.” And President Trump said it was not “ the beginning of a lengthy and aggressive rate-cutting cycle” that markets “wanted to hear.” Slower than expected pace of Fed monetary easing is bearish for gold prices.
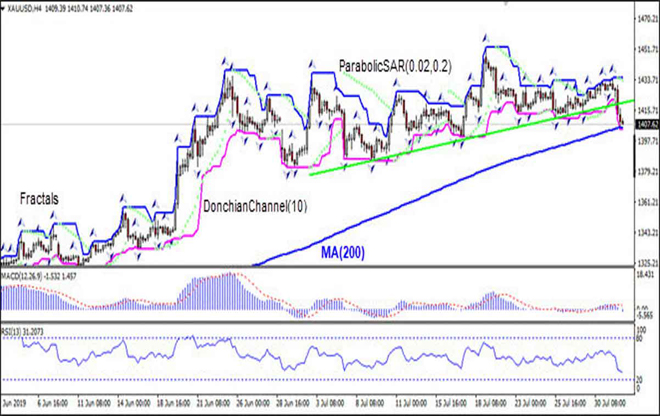
On the 4-hour timeframe the XAUUSD:H4 is retracing lower after breaching the support line, and is testing the 200-period Moving Average MA(200). These are bearish.
- The Parabolic indicator has formed a sell signal.
- The Donchian channel indicates downward bias: it is widening down.
- The MACD indicator gives a bearish signal: it is above the signal line and the gap is narrowing.
- The RSI oscillator is falling but has not reached the oversold zone yet.
We believe the bearish momentum will continue after the price breaches below the lower boundary of Donchian channel at 1404.08. This level can be used as an entry point for placing a pending order to sell. The stop loss can be placed below the last fractal high at 1435.07. After placing the order, the stop loss is to be moved every day to the next fractal high, following Parabolic signals. Thus, we are changing the expected profit/loss ratio to the breakeven point. If the price meets the stop loss level (1435.07) without reaching the order (1404.08), we recommend cancelling the order: the market has undergone internal changes which were not taken into account.
Technical Analysis Summary
| Order | Sell |
| Sell stop | Below 1404.08 |
| Stop loss | Above 1435.07 |
Explore our
Trading Conditions
- Spreads from 0.0 pip
- 30,000+ Trading Instruments
- Stop Out Level - Only 10%
Ready to Trade?
Open Account Note:
This overview has an informative and tutorial character and is published for free. All the data, included in the overview, are received from public sources, recognized as more or less reliable. Moreover, there is no guarantee that the indicated information is full and precise. Overviews are not updated. The whole information in each overview, including opinion, indicators, charts and anything else, is provided only for familiarization purposes and is not financial advice or а recommendation. The whole text and its any part, as well as the charts cannot be considered as an offer to make a deal with any asset. IFC Markets and its employees under any circumstances are not liable for any action taken by someone else during or after reading the overview.
