- Analytics
- Technical Analysis
Silver/US Dollar Technical Analysis - Silver/US Dollar Trading: 2018-03-27
Silver lags behind gold in growth
Since early 2018, silver prices have fallen by 1.4%, and gold price have risen by 4.1%. The US dollar index decreases despite the Fed's rate hike. Will the silver prices rise?
Investors consider precious metals as an alternative to investing in dollar assets. As a rule, the value of gold increases with the weakening of the US dollar. At present, silver lags noticeably behind gold in growth. The ratio of XAUXAG reached a 2-year high. The strengthening of political risks after the expulsion of 60 Russian diplomats from the US contributes to the general growth of precious metals prices. This decision was made amid the scandal over the poisoning of a former anti-Russian spy in the UK. On Monday, gold prices updated a 5-week high. Silver is also a precious metal. The increase in imports to China can indicate in favor of a possible increase in silver prices. According to the China's General Administration of Customs, in January-February 2018, silver imports increased by 36% compared to the same period of 2017 and amounted to 804.4 tons.
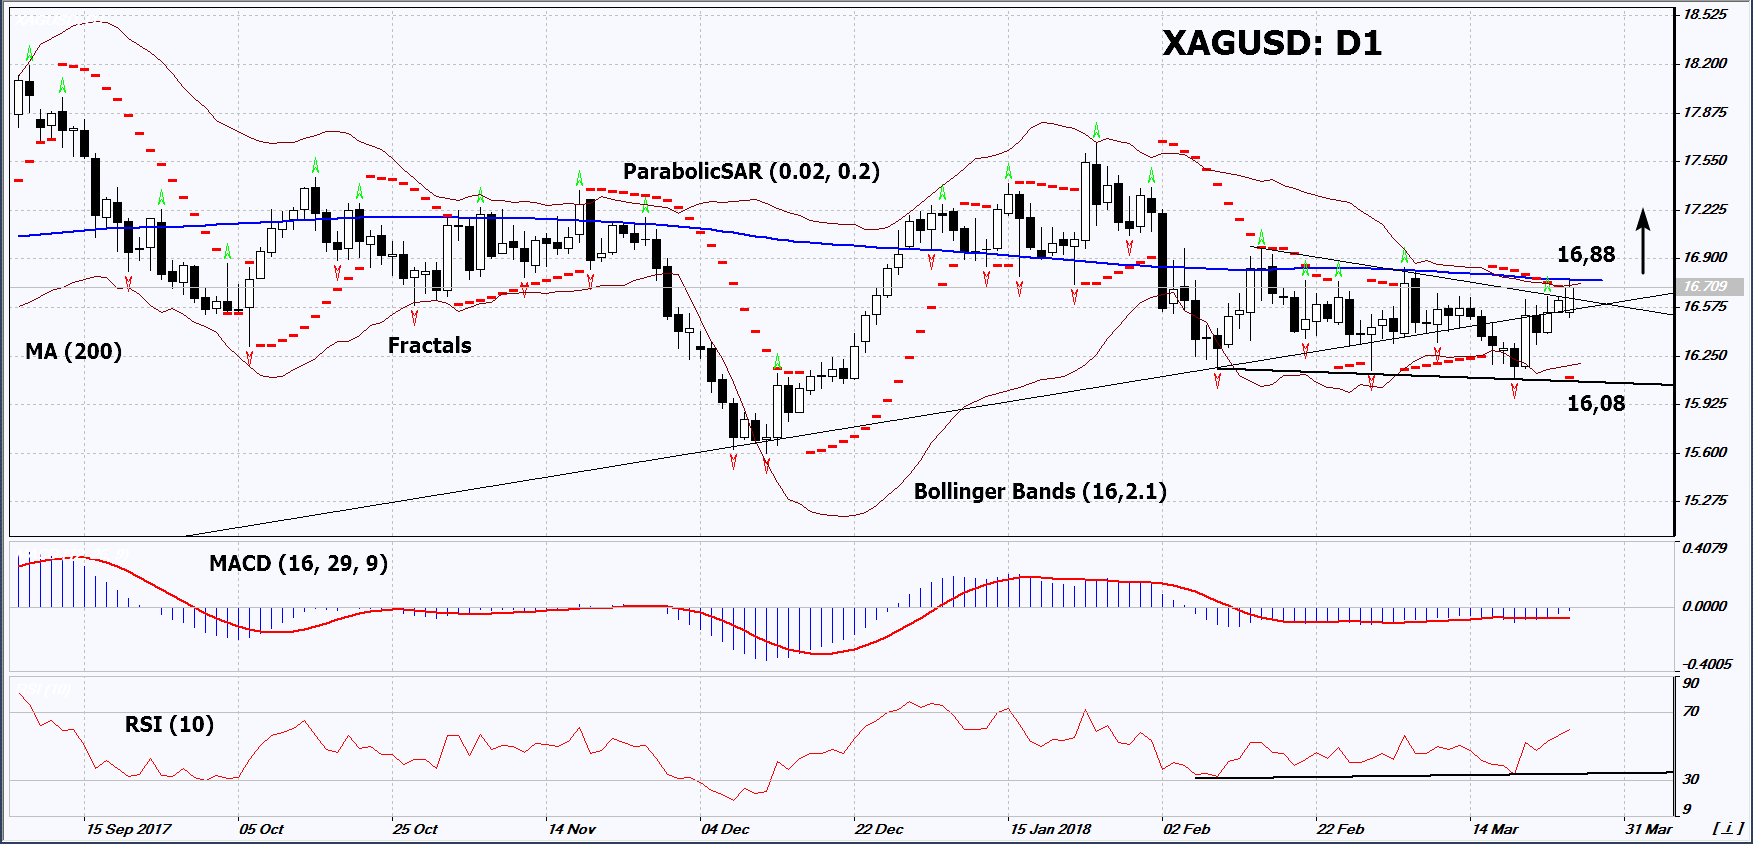
On the daily timeframe, XAGUSD: D1 is trying to move upward from the neutral range. The further price increase is possible in case of the publication of negative economic data in the US and the strengthening of global political risks.
- The Parabolic indicator gives a bullish signal.
- The Bollinger bands have narrowed, which indicates low volatility. They are tilted upward.
- The RSI indicator is above 50. It has formed a positive divergence.
- The MACD indicator gives a bullish signal.
The bullish momentum may develop in case XAGUSD exceeds the two fractal highs, the 200-day moving average line and the upper Bollinger band at 16.88. This level may serve as an entry point. The initial stop loss may be placed below the last fractal low, the lower Bollinger band and the Parabolic signal at 16.08. After opening the pending order, we shall move the stop to the next fractal low following the Bollinger and Parabolic signals. Thus, we are changing the potential profit/loss to the breakeven point. More risk-averse traders may switch to the 4-hour chart after the trade and place there a stop loss moving it in the direction of the trade. If the price meets the stop level at 16.88 without reaching the order at 16.08, we recommend cancelling the position: the market sustains internal changes that were not taken into account.
Summary of technical analysis
| Position | Buy |
| Buy stop | Above 16,88 |
| Stop loss | Below 16,08 |
Explore our
Trading Conditions
- Spreads from 0.0 pip
- 30,000+ Trading Instruments
- Stop Out Level - Only 10%
Ready to Trade?
Open Account Note:
This overview has an informative and tutorial character and is published for free. All the data, included in the overview, are received from public sources, recognized as more or less reliable. Moreover, there is no guarantee that the indicated information is full and precise. Overviews are not updated. The whole information in each overview, including opinion, indicators, charts and anything else, is provided only for familiarization purposes and is not financial advice or а recommendation. The whole text and its any part, as well as the charts cannot be considered as an offer to make a deal with any asset. IFC Markets and its employees under any circumstances are not liable for any action taken by someone else during or after reading the overview.
