- Analytics
- Technical Analysis
Wheat Ruble Technical Analysis - Wheat Ruble Trading: 2017-01-16
Sowings of winter wheat fell to lowest in 103 years
In this report we consider studying the personal composite instrument (PCI) ”wheat against ruble”. It is growing on the chart when the global wheat prices advance and ruble weakens against the US dollar. Will Wheat/RUB continue advancing?
USDA reported that US farmers cut sowings of winter wheat to 32.4mln acres this year. This is 10% lower than in previous year. The acreage of winter wheat sowings has reached the low since 1909. Amid this its prices reached the 4-1/2 month high. Global leader in wheat import, Egypt, lowered requirements for imported grains. Market participants believe this may be have been caused by higher wheat purchases by Egypt in global markets. Investors worry that cold weather may harm winter wheat sowings in EU countries. In Eastern Europe temperature came down to -30 °С. In France the December was the most dry since 1959. As a result, snow accumulation was low which may also harm crops of winter wheat. In its turn, ruble strengthened 18% to the US dollar in 2016. Its rate reached the low since July 2015 of 59 rubles per dollar. Theoretically, the reverse trend may follow, i.e. ruble may weaken due to lower global oil prices and anticipated rate cut of Russian Central Bank. Currently the rate is being 10% which contradicts low inflation of just 5.4% in 2016.
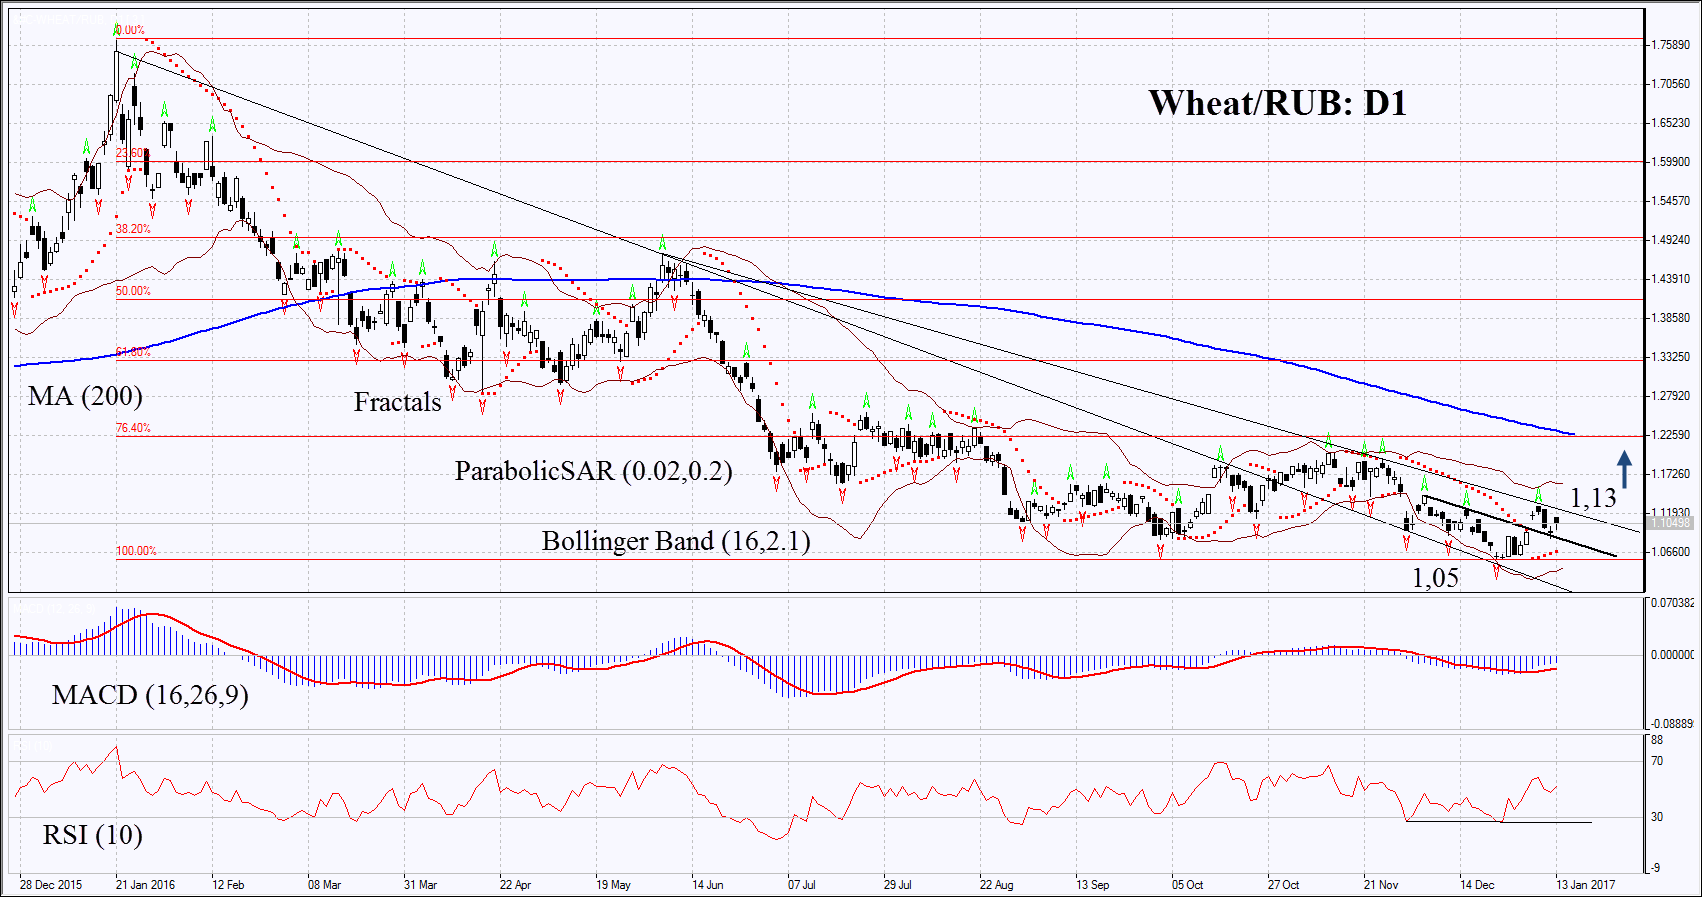
On the daily chart Wheat/RUB: D1 is correcting up from its low since May 2015. Further price increase is possible in case of higher wheat prices and weaker ruble.
- The Parabolic indicator gives bullish signal.
- The Bollinger bands have narrowed which means lower volatility. They are tilted upwards.
- The RSI is near the level of 50, no divergence.
- The MACD is giving bullish signals.
The bullish momentum may develop in case Wheat/RUB surpasses the level of resistance of the rising channel and the last fractal high at 1.13. This level may serve the point of entry. The initial stop-loss may be placed below the Parabolic signal, the last fractal low and the 1-1/2-year low at 1.05. Having opened the pending order we shall move the stop to the next fractal low following the Parabolic and Bollinger signals. Thus, we are changing the probable profit/loss ratio to the breakeven point. The most risk-averse traders may switch to the 4-hour chart after the trade and place there a stop-loss moving it in the direction of the trade. If the price meets the stop-loss level at 1.05 without reaching the order at 1.13, we recommend cancelling the position: the market sustains internal changes which were not taken into account.
Summary of technical analysis
| Position | Buy |
| Buy stop | above 1.13 |
| Stop loss | below 1.05 |
Explore our
Trading Conditions
- Spreads from 0.0 pip
- 30,000+ Trading Instruments
- Stop Out Level - Only 10%
Ready to Trade?
Open Account Note:
This overview has an informative and tutorial character and is published for free. All the data, included in the overview, are received from public sources, recognized as more or less reliable. Moreover, there is no guarantee that the indicated information is full and precise. Overviews are not updated. The whole information in each overview, including opinion, indicators, charts and anything else, is provided only for familiarization purposes and is not financial advice or а recommendation. The whole text and its any part, as well as the charts cannot be considered as an offer to make a deal with any asset. IFC Markets and its employees under any circumstances are not liable for any action taken by someone else during or after reading the overview.
