- Analytics
- Technical Analysis
S&P 500 Technical Analysis - S&P 500 Trading: 2017-11-30
Positive data bullish for SP500
Positive data and progress in tax cuts approval support market sentiment. Will SP500 continue rising?
The US economic growth accelerated to 3.3% in the Q3 from 3.1% in second quarter, according to the GDP’s second reading. Recent economic data were strong: the Conference Board’s US consumer confidence index rose to its highest reading since 2000, and the S&P/Case-Shiller national index of house prices rose at the fastest pace in more than three years. And the Senate Budget Committee approved the Republican tax bill setting it up for a full Senate vote planned later this week, possible as early as Thursday. Recent upbeat corporate reports, positive data and progress in tax cuts plan are bullish for US stocks.
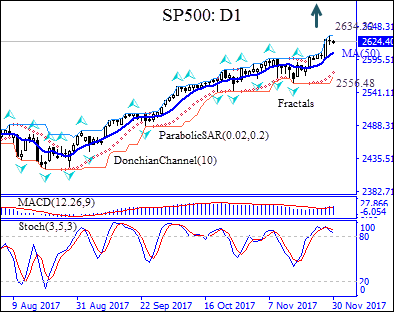
On the daily chart, the SP500: D1 closed at a record high in the previous session. It is above the 50-day moving average MA(50), which is rising.
- The Donchian channel indicates an uptrend: it is tilted up.
- The Parabolic indicator gives a buy signal.
- The MACD indicator also gives a bullish signal: it is above the signal line and the gap is widening.
- The stochastic oscillator is in the overbought zone: this is a bearish signal.
We believe the bullish momentum will continue after the price closes above the upper Donchain channel at 2634.32. A price above that level can be used as an entry point for a pending order to buy. The stop loss can be placed below the last fractal low at 2556.48. After placing the pending order the stop loss is to be moved every day to the next fractal low, following Parabolic signals. Thus, we are changing the probable profit/loss ratio to the breakeven point. More conservative traders can switch to the 4-hour chart and move the stop-loss in the direction of the trade. If the price meets the stop loss level (2556.48) without reaching the order (2634.32), we recommend cancelling the position: the market sustains internal changes which were not taken into account.
Technical Analysis Summary
| Position | Buy |
| Buy stop | Above 2634.32 |
| Stop loss | Below 2556.48 |
Explore our
Trading Conditions
- Spreads from 0.0 pip
- 30,000+ Trading Instruments
- Stop Out Level - Only 10%
Ready to Trade?
Open Account Note:
This overview has an informative and tutorial character and is published for free. All the data, included in the overview, are received from public sources, recognized as more or less reliable. Moreover, there is no guarantee that the indicated information is full and precise. Overviews are not updated. The whole information in each overview, including opinion, indicators, charts and anything else, is provided only for familiarization purposes and is not financial advice or а recommendation. The whole text and its any part, as well as the charts cannot be considered as an offer to make a deal with any asset. IFC Markets and its employees under any circumstances are not liable for any action taken by someone else during or after reading the overview.
