- Analytics
- Technical Analysis
Nikkei Index Technical Analysis - Nikkei Index Trading: 2017-07-05
Negative economic statistics may affect stock prices
Last week, several economic indicators were published in Japan, and they turned out to be negative. Will Nikkei prices fall?
The volume of retail trade in Japan for May decreased compared to April and was worse than the preliminary forecasts. The unemployment rate has grown to a maximum in the current year and amounted to 3.1%. The preliminary industrial production index for May fell by 3.3%, which was the biggest decrease since February 2016. An additional negative for Nikkei may be political factors – the new missile test in North Korea and defeat of the ruling Liberal Democratic Party in elections to the Tokyo legislative assembly. This week, no significant statistics will come out in Japan. The dynamics of Nikkei may depend on the publication of corporate reporting for the second quarter of 2017.
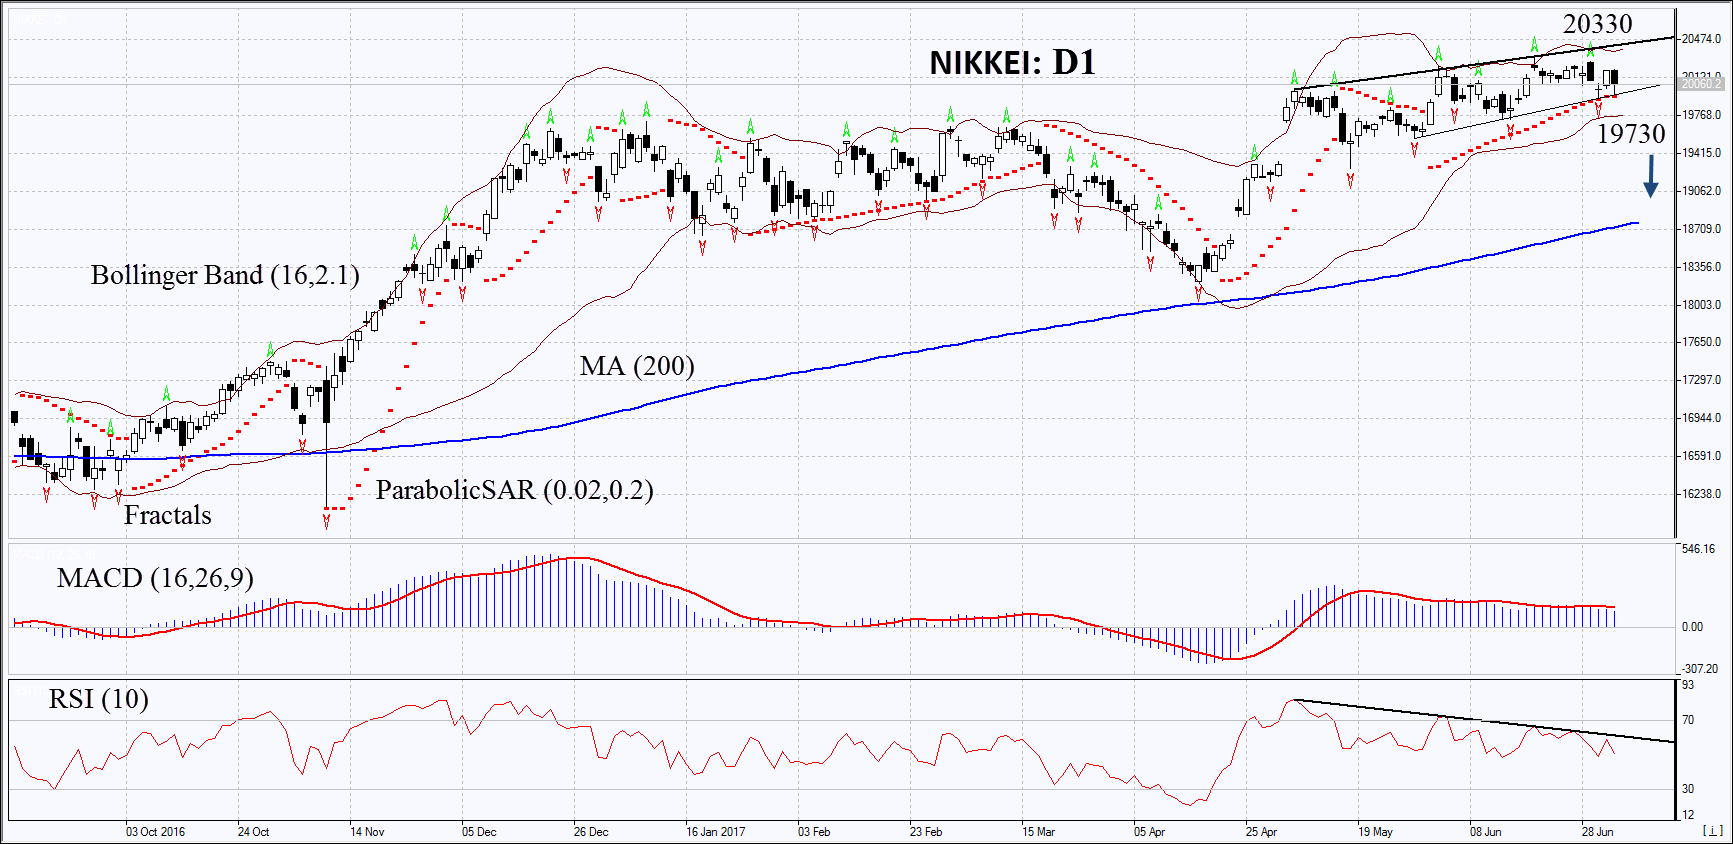
On the daily timeframe, Nikkei: D1 continues to be in a rising trend, but its increase has slowed down. A downward correction is possible in case of the worsening of economic indicators in Japan and negative corporate reporting for the second quarter.
- The Parabolic indicator is giving a bullish signal. It may be used as an additional support level, which needs to be breached by the chart before opening a sell position.
- The Bollinger bands have narrowed, which indicates low volatility.
- The RSI indicator is above 50. It has formed a double negative divergence.
- The MACD indicator is giving a bearish signal.
The bearish momentum may develop in case Nikkei falls below the two last fractal lows, the Parabolic signal and the lower Bollinger band at 19730. This level may serve as an entry point. The initial stop-loss may be placed above the two last fractal highs and a 2-year maximum at 20330. After opening the pending order, we shall move the stop to the next fractal high following the Bollinger and Parabolic signals. Thus, we are changing the potential profit/loss to the breakeven point. More risk-averse traders may switch to the 4-hour chart after the trade and place there a stop-loss moving it in the direction of the trade. If the price meets the stop level 20330 without reaching the order at 19730, we recommend cancelling the position: the market sustains internal changes that were not taken into account.
Summary of technical analysis
| Position | Sell |
| Sell stop | Below 19730 |
| Stop loss | Above 20330 |
Explore our
Trading Conditions
- Spreads from 0.0 pip
- 30,000+ Trading Instruments
- Stop Out Level - Only 10%
Ready to Trade?
Open Account Note:
This overview has an informative and tutorial character and is published for free. All the data, included in the overview, are received from public sources, recognized as more or less reliable. Moreover, there is no guarantee that the indicated information is full and precise. Overviews are not updated. The whole information in each overview, including opinion, indicators, charts and anything else, is provided only for familiarization purposes and is not financial advice or а recommendation. The whole text and its any part, as well as the charts cannot be considered as an offer to make a deal with any asset. IFC Markets and its employees under any circumstances are not liable for any action taken by someone else during or after reading the overview.
