- Analytics
- Technical Analysis
Dow Jones Index Technical Analysis - Dow Jones Index Trading: 2018-01-31
US indices are trying to correct down
US stocks dropped on the background of negative corporate news. Will the quotes of the Dow Jones Industrial Average decrease?
Large US corporations Amazon.com, Berkshire Hathaway and JPMorgan announced the creation of a joint company aimed at reducing the cost of healthcare for their employees in the United States. After that the stocks of UnitedHealth (-4.2%) and Pfizer (-3.2%) fell. Both companies are included in the Dow Jones company list. Market participants believe that stock indices may fall amid the growth of Treasury yields. They do not rule out an increase in demand for funds as the emission of the major Central Banks is curtailed. 10-year Treasury yields reached a high since April 2014 and exceeded 2.7% in annual terms. S&P 500 has been traded without a 5% correction for more than 400 days. This is the longest, uninterrupted growth in its entire history. At the beginning of the earnings season, market participants expected the net profit of S&P 500 to increase by 12%, and currently, this forecast has increased to plus 13.2%. At the same time, at present, less than a third of the S&P 500 companies has reported. A downward correction may be triggered in case of a negative quarterly earnings report of a large company.
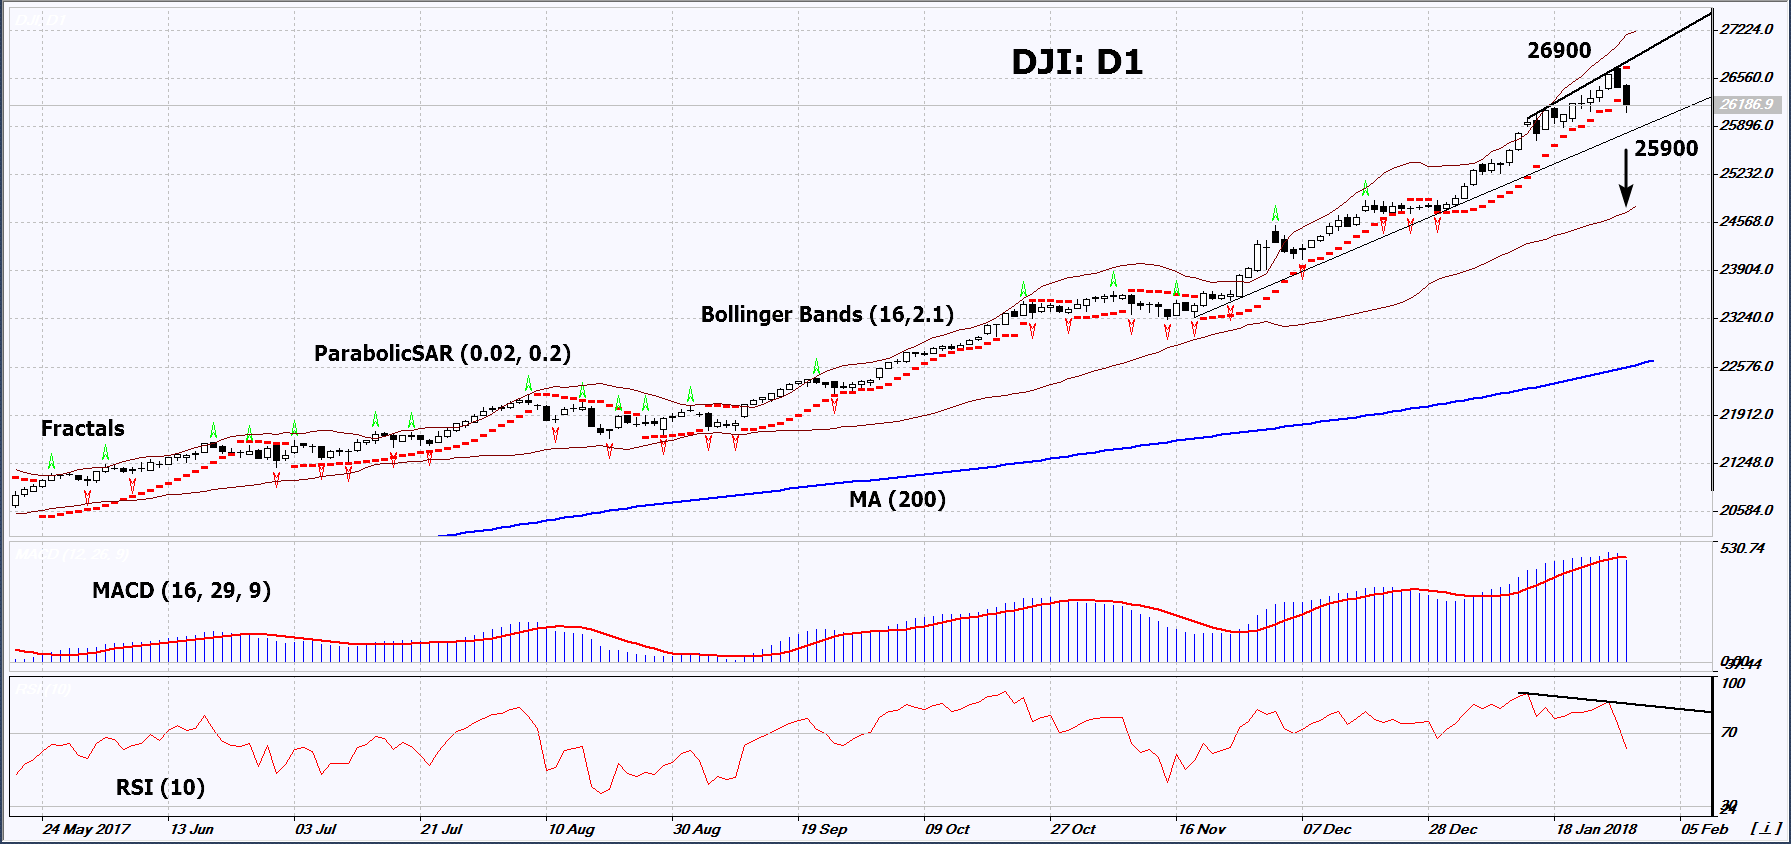
On the daily timeframe, DJI: D1 remains in the rising trend, but its growth has slowed down and some technical analysis indicators formed Sell signals. A downward correction is possible in case of the publication of negative economic and corporate information in the US.
- The Parabolic indicator gives a bearish signal.
- The Bollinger bands have widened, which means higher volatility.
- The RSI indicator is above 50. It has formed a negative divergence.
- The MACD indicator gives a bearish signal.
The bearish momentum may develop in case DJI drops below its last low at 25900. This level may serve as an entry point. The initial stop loss may be placed above the historic high and the Parabolic signal at 26900. After opening the pending order, we shall move the stop to the next fractal high following the Bollinger and Parabolic signals. Thus, we are changing the potential profit/loss to the breakeven point. More risk-averse traders may switch to the 4-hour chart after the trade and place there a stop loss moving it in the direction of the trade. If the price meets the stop level at 26900 without reaching the order at 25900, we recommend cancelling the position: the market sustains internal changes that were not taken into account.
Summary of technical analysis
| Position | Sell |
| Sell stop | below 25900 |
| Stop loss | above 26900 |
Explore our
Trading Conditions
- Spreads from 0.0 pip
- 30,000+ Trading Instruments
- Stop Out Level - Only 10%
Ready to Trade?
Open Account Note:
This overview has an informative and tutorial character and is published for free. All the data, included in the overview, are received from public sources, recognized as more or less reliable. Moreover, there is no guarantee that the indicated information is full and precise. Overviews are not updated. The whole information in each overview, including opinion, indicators, charts and anything else, is provided only for familiarization purposes and is not financial advice or а recommendation. The whole text and its any part, as well as the charts cannot be considered as an offer to make a deal with any asset. IFC Markets and its employees under any circumstances are not liable for any action taken by someone else during or after reading the overview.
