- Analytics
- Technical Analysis
CORN Technical Analysis - CORN Trading: 2018-07-19
A decrease in corn harvest is expected in Brazil
The agricultural agency Companhia Nacional de Abastecimento (Conab) reduced the forecast of corn harvest in Brazil. Will Corn prices rise?
Now it is expected that the corn harvest in Brazil in the 2017/18 agricultural season will be reduced to 82.9 million tons from 97.8 million tons. In the previous forecast of Conab, it was estimated at the level of 85 million tons. South Korea’s Korea Corn Processing Industry Association (KOCOPIA) purchased 60 thousand tons of American corn at the last tender. In June and in July, it acquired 2 million tons of corn, which is only 20% of the required volume. Meanwhile, the forecasts of the harvest in the US may be reduced because of the drought in the Midwest. Meantime, the US Department of Agriculture reduced the assessment of corn crops "good to excellent" from 75% to 72% in its weekly overview published on Monday.
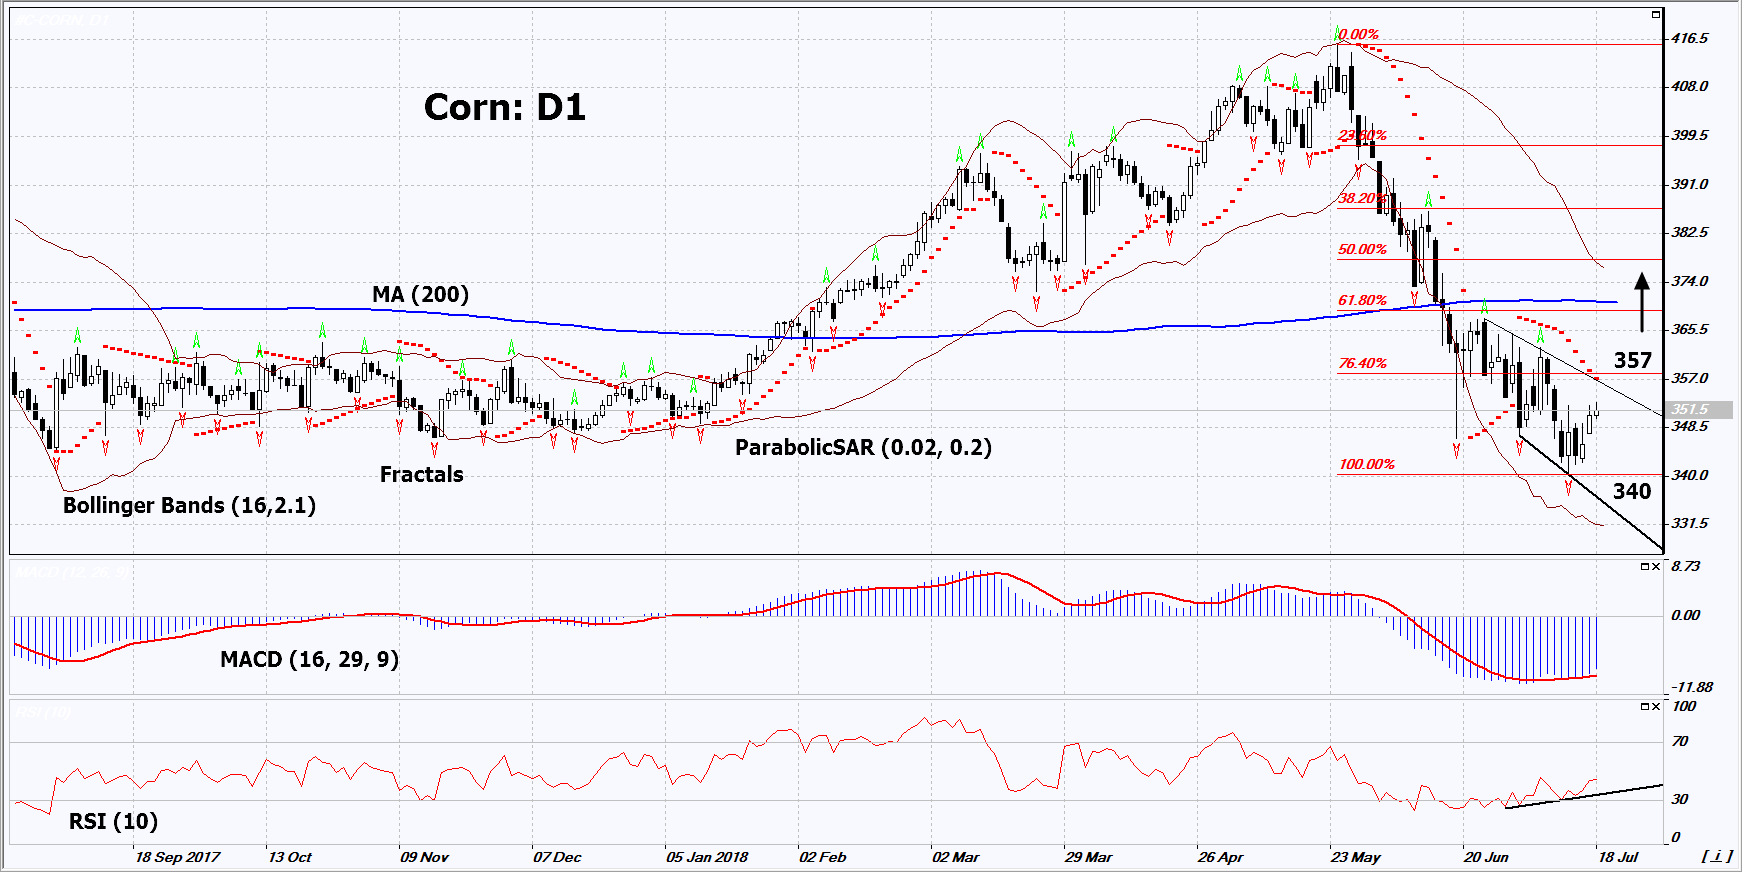
On the daily timeframe, Corn: D1 has updated the low since October 2016 and is moving to the upper boundary of the falling channel. It should be overcome before opening a buy position. A number of technical analysis indicators formed buy signals. The further price increase is possible in case of the deterioration of weather conditions and reduction of the world harvest in the current season.
- The Parabolic indicator gives a bearish signal. It should be overcome before opening a buy position.
- The Bollinger bands have widened, which indicates high volatility. They are titled upward.
- The RSI indicator is below 50. It has formed a positive divergence.
- The MACD indicator gives a bullish signal.
The bullish momentum may develop in case Corn exceeds the Parabolic signal and the resistance line of the downtrend at 357. This level may serve as an entry point. The initial stop loss may be placed below the last fractal low at 340. After opening the pending order, we shall move the stop to the next fractal low following the Bollinger and Parabolic signals. Thus, we are changing the potential profit/loss to the breakeven point. More risk-averse traders may switch to the 4-hour chart after the trade and place there a stop loss moving it in the direction of the trade. If the price meets the stop level (340) without reaching the order (357), we recommend to close the position: the market sustains internal changes that were not taken into account.
Summary of technical analysis
| Position | Buy |
| Buy stop | Above 357 |
| Stop loss | Below 340 |
Explore our
Trading Conditions
- Spreads from 0.0 pip
- 30,000+ Trading Instruments
- Stop Out Level - Only 10%
Ready to Trade?
Open Account Note:
This overview has an informative and tutorial character and is published for free. All the data, included in the overview, are received from public sources, recognized as more or less reliable. Moreover, there is no guarantee that the indicated information is full and precise. Overviews are not updated. The whole information in each overview, including opinion, indicators, charts and anything else, is provided only for familiarization purposes and is not financial advice or а recommendation. The whole text and its any part, as well as the charts cannot be considered as an offer to make a deal with any asset. IFC Markets and its employees under any circumstances are not liable for any action taken by someone else during or after reading the overview.
