- Analytics
- Technical Analysis
Caterpillar Technical Analysis - Caterpillar Trading: 2015-12-29
Markets positively react on small fine imposed on Caterpillar
Caterpillar Inc. stocks sky-rocketed after the US court found the company guilty of causing damage to its supplier Miller UK Ltd. Markets positively reacted on a relatively small fine of $74mln imposed on Caterpillar. Will the stocks continue their way up?
The case against the company was commenced way back 5 years ago. The ongoing trial lost by Caterpillar took 8 weeks. Miller UK Ltd accused the US company of stealing its trade secrets to design the diggers. Since the start of 2015 the Caterpillar stocks have already lost 26% underperforming the Dow Jones Industrial which lost only 2%. In the meantime, Caterpillar got net quarterly profit throughout the whole year although the accumulated net profits fell 25% in 9 months compared to the same period of 2014. The company’s performance may improve in Q4. In November 2015 the gross sales of machinery and equipment fell only 11% compared to November 2014.
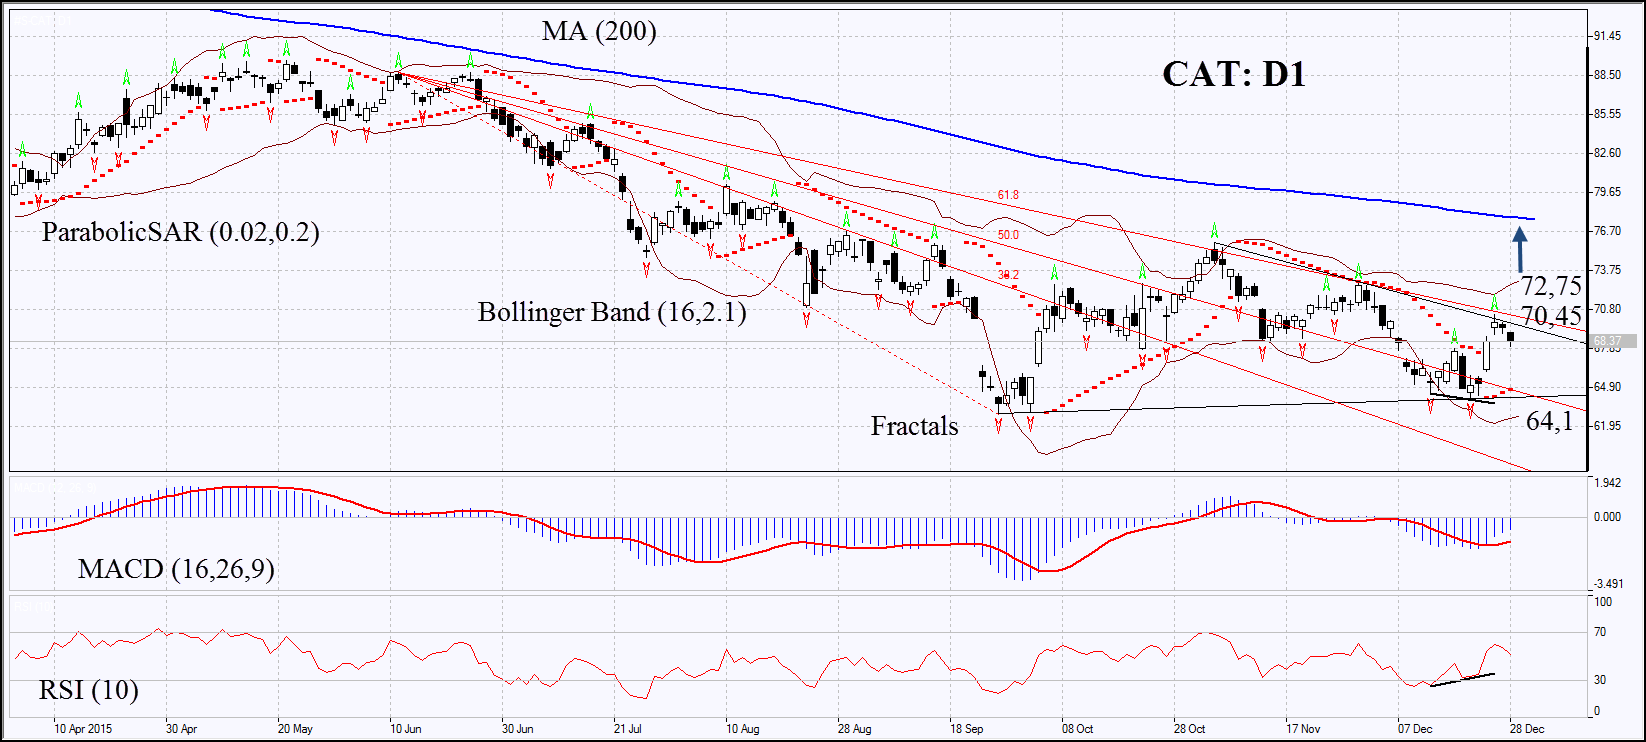
On the daily chart CAT: D1 failed to renew the 5-year low for the second time and began the moderate growth within the neutral trend. Parabolic and MACD indicators give buy signals. The Bollinger bands have slightly contracted which may mean lower volatility and are tilted upwards. RSI has formed the positive divergence. The bullish momentum may develop in case Caterpillar stocks surpass the last or the second fractal highs at 70.45 or 72.75. These levels may serve the point of entry. The initial risk-limit may be placed below the last fractal low at 64.1. Having opened the pending order we shall move the stop to the next fractal low following the Parabolic and Bollinger signals. Thus, we are changing the probable profit/loss ratio to the breakeven point. The most risk-averse traders may switch to the 4-hour chart after the trade and place there a stop-loss moving it in the direction of the trade. If the price meets the stop-loss level at 64.1 without reaching the order at 70.45 or 72.75, we recommend cancelling the position: the market sustains internal changes which were not taken into account.
| Position | Buy |
| Buy stop | above 70.45 or 72.75 |
| Stop loss | below 64.1 |
Explore our
Trading Conditions
- Spreads from 0.0 pip
- 30,000+ Trading Instruments
- Stop Out Level - Only 10%
Ready to Trade?
Open Account Note:
This overview has an informative and tutorial character and is published for free. All the data, included in the overview, are received from public sources, recognized as more or less reliable. Moreover, there is no guarantee that the indicated information is full and precise. Overviews are not updated. The whole information in each overview, including opinion, indicators, charts and anything else, is provided only for familiarization purposes and is not financial advice or а recommendation. The whole text and its any part, as well as the charts cannot be considered as an offer to make a deal with any asset. IFC Markets and its employees under any circumstances are not liable for any action taken by someone else during or after reading the overview.
