- Analytics
- Technical Analysis
Amazon Technical Analysis - Amazon Trading: 2015-11-17
Amazon stocks outperform
Since the beginning of the year the stocks of the online retailer Amazon.com advanced more than twofold outperforming the US hi-tech index Nasdaq 100 by 6% over the same period. Will the company’s stocks retrace down?
In 9 months of the present year Amazon.com managed to gain $114mln of net profit, against the loss of $455mln. during the same period of 2014, which is not bad altogether. With the company’s capitalization over $300bn, its shares are traded with P/E of 932 which is far above the yearly average P/E for Nasdaq 100 of 21.4. The average net operating margin for Nasdaq is 1.6% this year which is below the similar average reading of 2.4% for the e-commerce sector. In our opinion, the aggravating competition with other companies may possibly affect the stocks’ prices. In particular, Amazon is planning to stop sales of Google Chromecast adapters and Apple-TVs as they rival its own Fire TV and Fire TV Stick products. In response, the Amazon.com products may disappear from Google Play online shop. The company rivals a lot the Chinese online retailers Alibaba, JD.com and others as well as the similar shops in other countries.
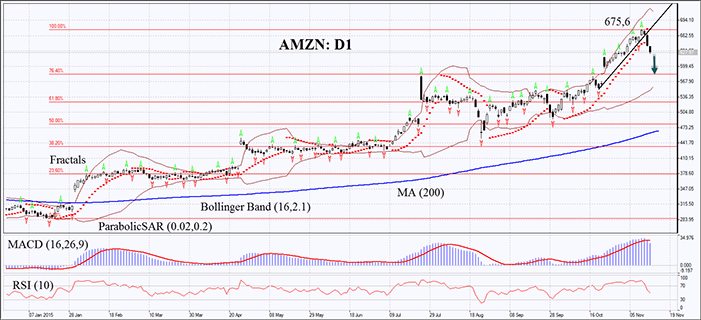
On the daily chart the AMZN:D1 hit a historical high 4 days ago. At the moment its shares have broken through the support of the uptrend and are correcting down. The prices are far above the 200-day moving average line. The Parabolic indicator and MACD have formed sell signals. The Bollinger bands have widened significantly which means high volatility. RSI has left the overbought zone and approached the level of 50. The bearish momentum may develop considering Amazon.com stocks. The “sell by market” order can be used to open position. The initial risk-limit may be placed above the historical high, the Parabolic signal and the last fractal high at 675.6. Having opened the pending order we shall move the stop to the next fractal high following the Parabolic and Bollinger signals every 4 hours. Thus, we are changing the probable profit/loss ratio to the breakeven point. The most risk-averse traders may switch to the 4-hour chart after the trade and place there a stop-loss moving it in the direction of the trade.
| Position | Sell |
| Sell by market | by market |
| Stop loss | above 675,6 |
Explore our
Trading Conditions
- Spreads from 0.0 pip
- 30,000+ Trading Instruments
- Stop Out Level - Only 10%
Ready to Trade?
Open Account Note:
This overview has an informative and tutorial character and is published for free. All the data, included in the overview, are received from public sources, recognized as more or less reliable. Moreover, there is no guarantee that the indicated information is full and precise. Overviews are not updated. The whole information in each overview, including opinion, indicators, charts and anything else, is provided only for familiarization purposes and is not financial advice or а recommendation. The whole text and its any part, as well as the charts cannot be considered as an offer to make a deal with any asset. IFC Markets and its employees under any circumstances are not liable for any action taken by someone else during or after reading the overview.
