- Analytics
- Technical Analysis
Adobe Technical Analysis - Adobe Trading: 2016-05-04
How Adobe quarterly statement may affect its stocks?
The US Adobeа published the Digital Price Index (DPI) which reflects the price changes in hi-tech goods. Since February 2015 to February 2016 the segment of TVs, PCs, electronic games and other gadgets suffered from deflation which may mean lower consumer demand. Judging by DPI, the prices slumped from 2.5% to 20.3%. According to U.S. Bureau of Labor Statistics, they tumbled 0.5-15%. Adobe is actively working on new cloud technologies for data storage and use. Will the probable fall in demand have a negative effect on company’s stocks?
Adobe quarterly report for Q1 2016 was released in mid-March. The company received the record operating income and its stocks hit a fresh historical high. We assume the investors expectations on further positive dynamics in Adobe financial performance may be unreasonably high. The company’s stocks are traded with trailing P/E of равным 40 which is far above the average for the sector Р/Е of 16.7 and the average Р/Е of 21 for Nasdaq 100 index. The majority of other comparative ratios for Adobe are also above the industry average. For example, the EV/Sales is 8.6 compared to the industry average of 4.1. The next quarterly statements of the company will be released on June 21. Another negative for Adobe stocks may be the repetitive vulnerability of its Flash Player product. Some market participants are afraid of such faults in cloud technologies.
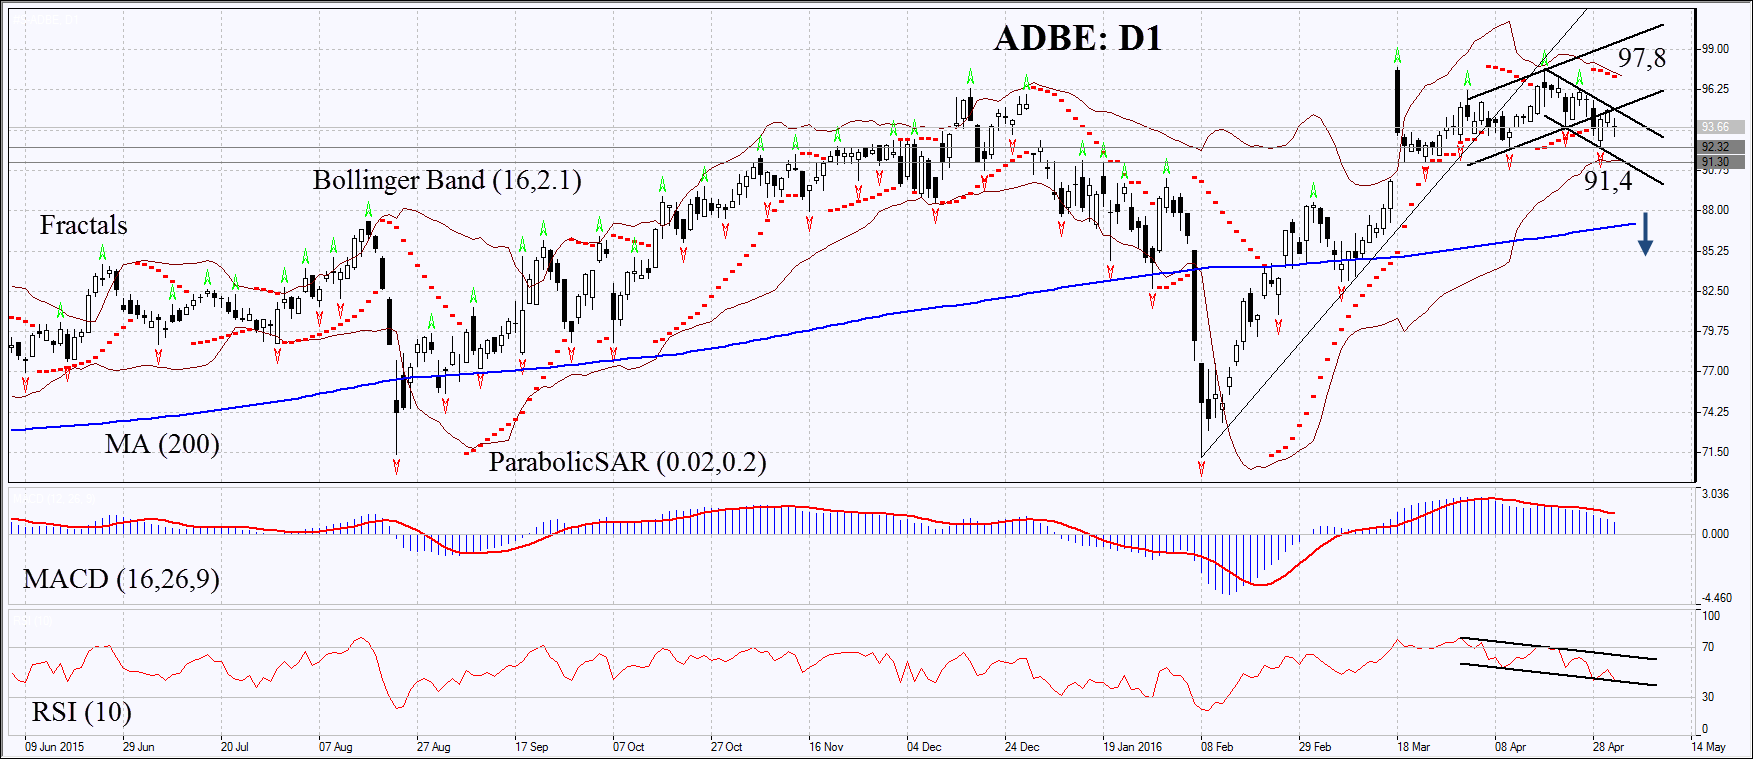
On the daily chart ADBE: D1 failed to renew its historical high and left the uptrend to move downwards. The MACD and Parabolic indicators give signals to sell. RSI has formed the negative divergence and fell below 50. The Bollinger bands have contracted a lot which means lower volatility. The bearish momentum may develop in case the Adobe stocks fall below the three last fractal lows at 92.2. This level may serve the point of entry. The most conservative traders may wait for breaking through support of the downtrend and the lower Bollinger band at 91.4. The initial risk-limit may be placed above the historical high, the Bollinger band and Parabolic signal and the last four fractal highs at 97.8. Having opened the pending order we shall move the stop to the next fractal high following the Parabolic and Bollinger signals. Thus, we are changing the probable profit/loss ratio to the breakeven point. The most risk-averse traders may switch to the 4-hour chart after the trade and place there a stop-loss moving it in the direction of the trade. If the price meets the stop-loss level at 97.8 without reaching the order at 92.2 or 91.4, we recommend cancelling the position: the market sustains internal changes which were not taken into account.
| Position | Sell |
| Sell stop | below 92.2 or 91.4 |
| Stop loss | above 97.8 |
Explore our
Trading Conditions
- Spreads from 0.0 pip
- 30,000+ Trading Instruments
- Stop Out Level - Only 10%
Ready to Trade?
Open Account Note:
This overview has an informative and tutorial character and is published for free. All the data, included in the overview, are received from public sources, recognized as more or less reliable. Moreover, there is no guarantee that the indicated information is full and precise. Overviews are not updated. The whole information in each overview, including opinion, indicators, charts and anything else, is provided only for familiarization purposes and is not financial advice or а recommendation. The whole text and its any part, as well as the charts cannot be considered as an offer to make a deal with any asset. IFC Markets and its employees under any circumstances are not liable for any action taken by someone else during or after reading the overview.
