- Education
- Forex Technical Analysis
- Simple Moving Average
Simple Moving Average - SMA Indicator
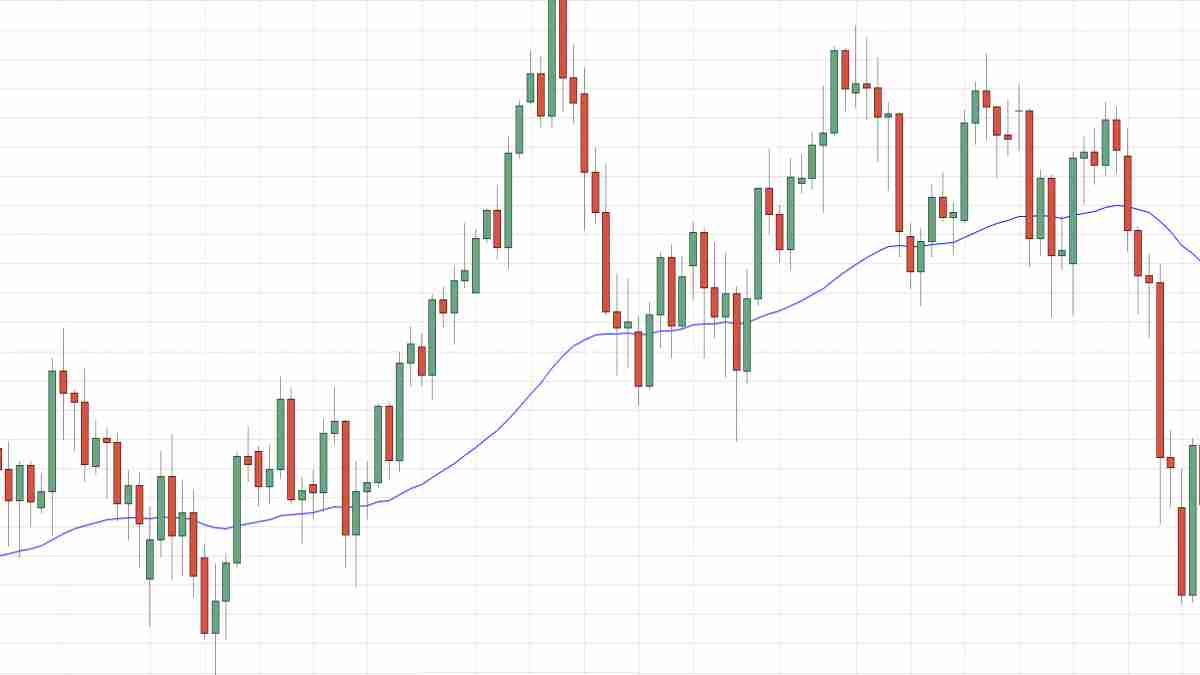
A Simple Moving Average (SMA) is a technical indicator that helps smooth price data by calculating the average price of a selected asset over a specified number of time periods.
For example, a 5-day SMA adds up the closing prices of the last 5 days and divides by 5. That way traders will have a clearer view of the overall price trend, filtering out short term noise.
Simple Moving averages are used to identify trend direction, potential reversals, and support or resistance levels.

Simple Moving Average Example
An SMA is calculated by adding the closing price of the instrument to the number of time periods and then dividing the total number by the number of time periods. The result will be the average price of the instrument over a certain time period.
Thus, in order to calculate a 10-day SMA, it's necessary to add closing prices over a 10-day period and divide the total number by 10. As the term ''moving'' implies, prices move according to the point on the chart. This means that always a new calculation is needed that can correspond to the time period of the average used. Thus, you can recalculate a 10-day average by adding the new day and missing out the 10th day and so on.
Though simple moving average is used by most traders and analysts, it is criticized for two reasons. The first criticism is that only the time period covered by the average is taken into consideration. And secondly, the SMA gives equal weight to each day's price.
Nevertheless, Simple Moving Average has become a preferred method for tracking prices due to its simplicity and quick calculation. By the same simplicity early market analysts performed the market analysis without using complicated chart metrics that are widely applied today. They mainly relied on market prices as the main means of tracking trends and market direction. This process was boring but was confirmed to be profitable and reliable, and up till now it continues to be a popular technical analysis tool extensively used by most traders.
Simple Moving Average Formula
Moving averages are used to identify the trend direction of an instrument it is also used to determine support and resistance levels. It is a lagging indicator because it is based on past prices. Now there are different types of MAs based on how it is calculated. Here we are going to talk about SMA - simple moving average. SMA helps smooth out price data by calculating the average price of an instrument over a specific number of periods.
Calculation is simpleSMA = (A1 + A2 + A3 + … + An)/n
Where:
- A1, A2, …, An are the instrument’s prices at each time period
- n is the number of periods (e.g., 5 for a 5-day SMA)
For example, to calculate a 5-day SMA, you add the closing prices of the last 5 days and divide the sum by 5. This gives you the average price over those 5 days, plotted as a single point on a chart. Repeating this process over time produces the SMA line.
How it Works Step by Step
Let’s say you want to calculate a 5-day Simple Moving Average for a stock.
| Day | Closing Price |
| Day 1 | 20 |
| Day 2 | 50 |
| Day 3 | 24 |
| Day 4 | 23 |
| Day 5 | 15 |
SMA = (20 + 50 + 24 + 23 + 15)/5 = 26.4
SMA Pros and Cons
As any other technical indicator, Simple Moving Average has its strengths and limitations. While it's widely used for identifying trends and smoothing out market noise, it’s not always the best choice in sharp volatile or sideways markets. Below we’ll list where SMA falls short and where it’s best to use.
Pros of SMA
- Easy to understand and calculate. Even beginners can use it effectively.
- Smooths out price noise - Filters out daily price fluctuations, giving a clearer picture of the trend.
- Useful for spotting the general direction of price over time (uptrend, downtrend, sideways).
- Widely used across trading platforms and strategies. 50-day and 200-day SMAs are widely used by investors and traders and are important trading signals.
- Helps confirm momentum when prices follow a clear upward or downward path.
Cons of SMA
- Because it gives equal weight to all periods, it’s less responsive to recent price changes.
- It’s a Lagging indicator, SMA is based on past data. It reacts after the trend has already begun or reversed.
- In sideways markets SMA can give false signals or whipsaws.
- Misses early reversals, it signals trend changes late, causing missed opportunities or delayed exits. SMA doesn’t emphasize the most recent data, which is a minus.
| Feature | SMA |
| Calculation | Equal weight for all periods |
| Speed | Slower, more stable |
| Usefulness | Trend-following, support/resistance |
| Strength | Clear view of long-term direction |
| Weakness | Lags in volatile or fast markets |
SMA vs EMA
Both the SMA and EMA are tools used to smooth out price data and highlight trends, but they operate differently and serve slightly different purposes.
- SMA calculates the average by giving equal weight to all price points over the selected period. As a result, it reacts more slowly to price changes and is best suited for stable or long-term trends where a steady indicator is preferred.
- EMA, on the other hand, gives more weight to recent prices, making it more sensitive and responsive to new information. This responsiveness makes EMA more useful in short-term trading or volatile markets where quick reaction to price movement is critical.
Because of this, SMA tends to produce fewer false signals but lags more. EMA reacts faster but can generate more whipsaws in choppy conditions. In practice, traders use both SMA for broader trend direction and EMA for faster signals.
Use SMA when you're focused on identifying the overall trend with stability. Use EMA when timing and responsiveness to short-term price shifts are more important.
How Traders Use SMA in Real Strategies
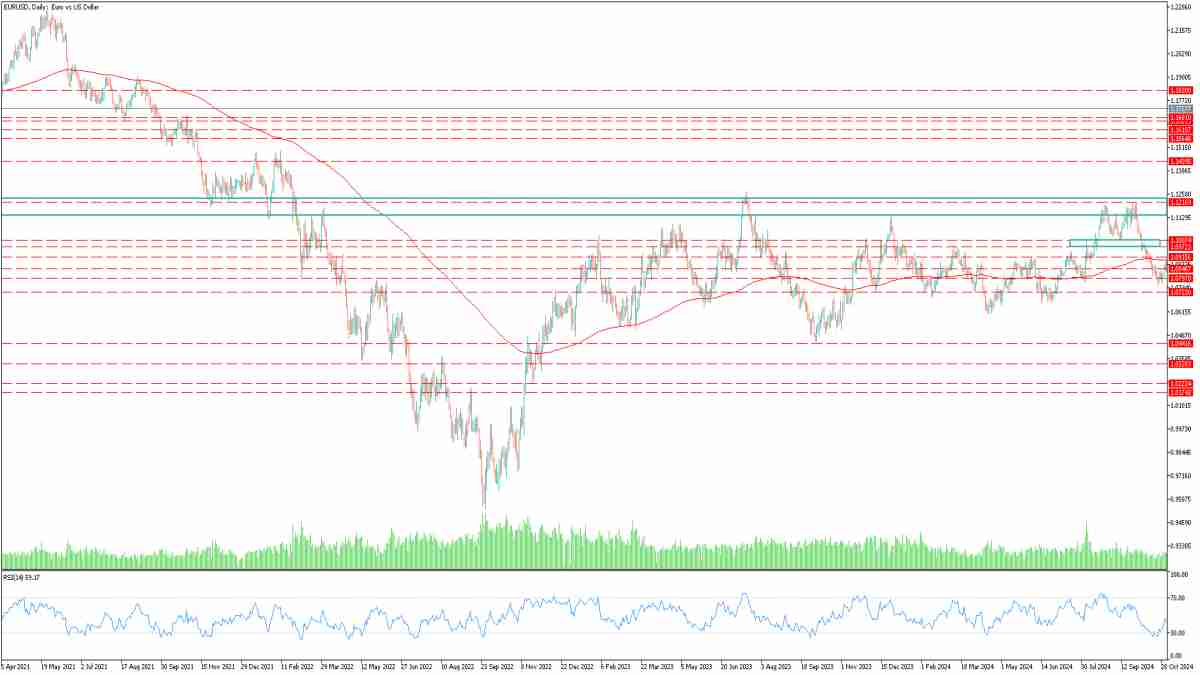
SMA is rarely used alone, it is used with other indicators for example, RSI, with its help traders learn whether an asset is overbought or oversold or . Price action and candlestick patterns are also critical, especially when prices approach the SMA line, which often acts as dynamic support or resistance.
For example, a trader might wait for a price to bounce off the 50-day SMA while RSI shows the asset is oversold. If a bullish candlestick pattern forms at that point, it can serve as a strong entry signal.
SMA in Strategy
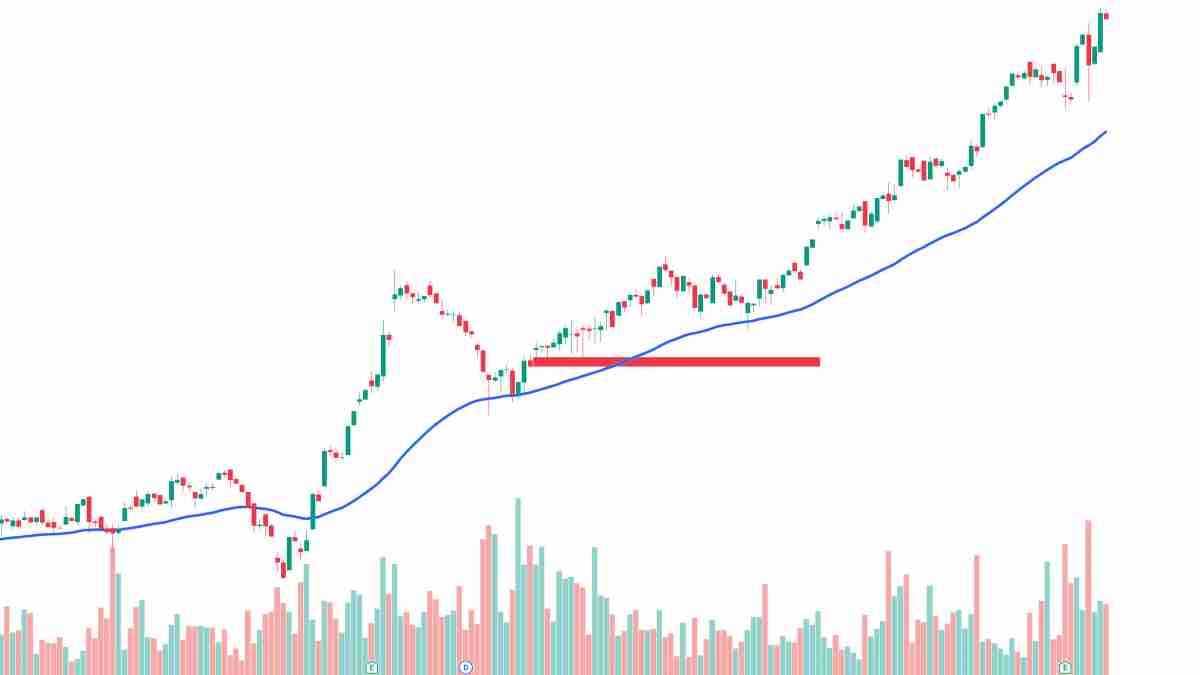
One common approach is the pullback strategy, where traders buy into an uptrend when the price pulls back to the 20-day or 50-day SMA and shows signs of bullish reversal.

Another is breakout confirmation. When the price breaks above the 200-day SMA with strong volume, it’s often seen as confirmation that a longer term downtrend may be reversing.

Some traders also use SMA as a trend filter, for instance, only taking long positions when the price is above the 200-day SMA, and avoiding trades that go against the dominant trend.

SMA is simple in nature, its real power lies in how it interacts with other signals.
Conclusion
SMA remains one of the most widely used and reliable tools in technical analysis. Its core strength lies in its simplicity, since it offers a clear and accessible way to understand market trends, filter out short term noise, and identify key support and resistance levels.

