- تحليلات
- التحليل الفني للسوق
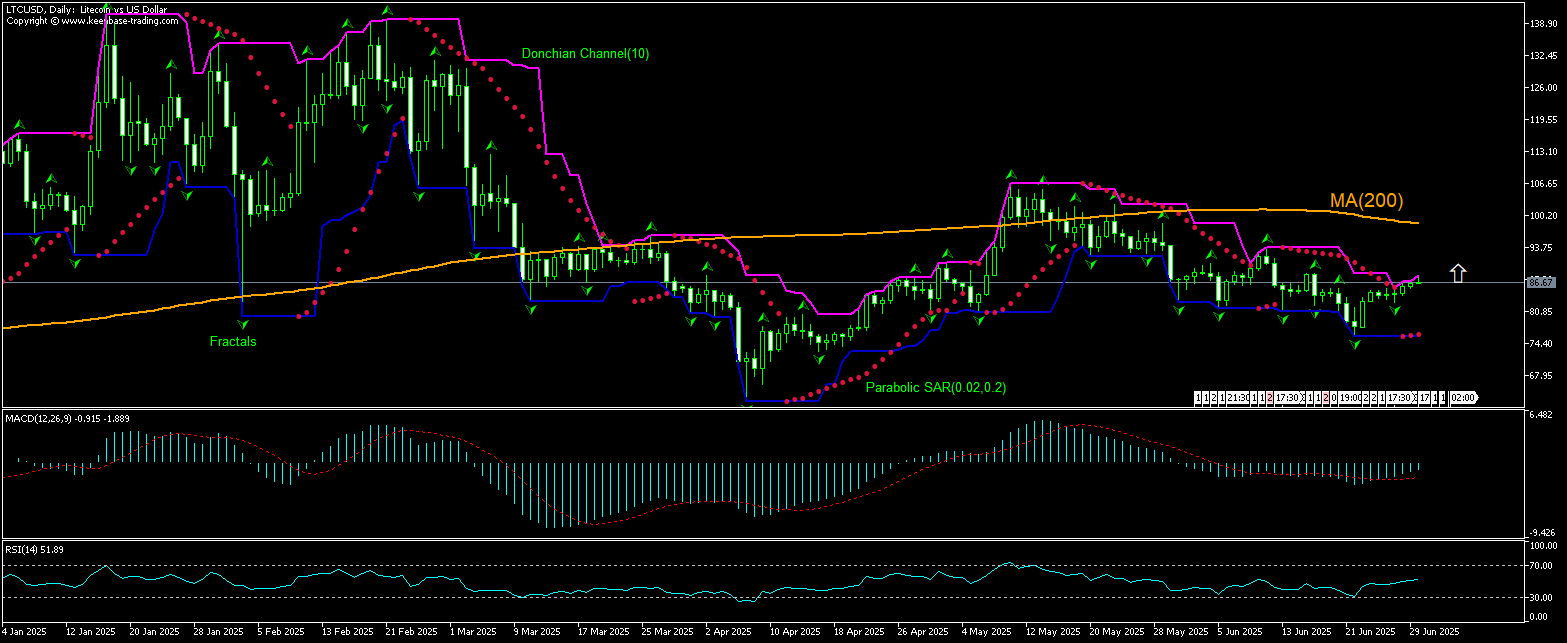
LTCUSD التحليل الفني - LTCUSD التداول: 2025-06-30
LTCUSD ملخص التحليل الفني
أعلى من 88.09
Buy Stop
أقل من 91.39
Stop Loss
| مؤشر | الإشارة |
| RSI | محايد |
| MACD | شراء |
| MA(200) | بيع |
| Fractals | شراء |
| Parabolic SAR | شراء |
LTCUSD تحليل الرسم البياني
LTCUSD التحليل الفني
The LTCUSD technical analysis of the price chart on daily timeframe shows LTCUSD,Daily is rebounding toward the 200-period moving average MA(200) after hitting 9-week low eight days ago. We believe the bullish momentum will continue after the price breaches above the upper boundary of Donchian channel at 88.09. A level above this can be used as an entry point for placing a pending order to buy. The stop loss can be placed below 81.39. After placing the order, the stop loss is to be moved to the next fractal low , following Parabolic indicator signals. Thus, we are changing the expected profit/loss ratio to the breakeven point. If the price meets the stop loss level without reaching the order, we recommend cancelling the order: the market has undergone internal changes which were not taken into account.
التحليل الأساسي لـ تشفير - LTCUSD
LTCUSD is attempting a rebound as traders bet on LTC ETF approval. Will the LTCUSD price rebound continue?
Litecoin (LTC) rose almost 9% last week as traders anticipate a regulatory boost: the U.S. Securities and Exchange Commission is reviewing two bids for a spot Litecoin ETF. Couple of weeks ago Bloomberg analyst Seyffart estimated the chances for a Litecoin spot ETF being greenlighted this year stand at 90%. Polymarket traders assign an 83% chance to SEC approval of a LTC ETF this year. A green light to such a fund this year would open LTC exposure to investors betting on crypto through traditional brokerages. Expectations of a LTC ETF approval by SEC are bullish for LTCUSD price.
استكشف
شروط التداول لدينا
- فروق الأسعار من 0.0 نقطة
- أكثر من 30,000 أداة تداول
- التنفيذ الفوري
هل أنت مستعد للتداول؟
فتح حساب :تنبيه
يحمل هذا الموجز طابعاً إعلامياً و تعليمياً و تنشر بالمجان . تأتي معظم البيانات المدرجة في الموجز من المصادر العامة معترفة أكثر و أقل موثوقية . مع ذلك ، لا يوجد تأكيد على أن المعلومات المشارة إليها كاملة و دقيقة . لا يتم تحديث الموجز . معظم المعلومات في كل موجز ، تتضمن الرأي و المؤشرات و الرسوم البيانية و أي شيئ اخر وتقدم فقط لأغراض التعريف وليس المشورة المالية أو توصية . لا يمكن اعتبار النص باكماله أو أي جزء منه و أيضاً الرسوم البيانية كعرض لقيام بصفقة بأي اداة . آي إف سي ماركيتس وموظفيها ليست مسؤولة تحت أي ظرف من الظروف عن أي إجراء يتم اتخاذه من قبل شخص آخر أثناء أو بعد قراءة نظرة عامة .

