- تحليلات
- التحليل الفني للسوق
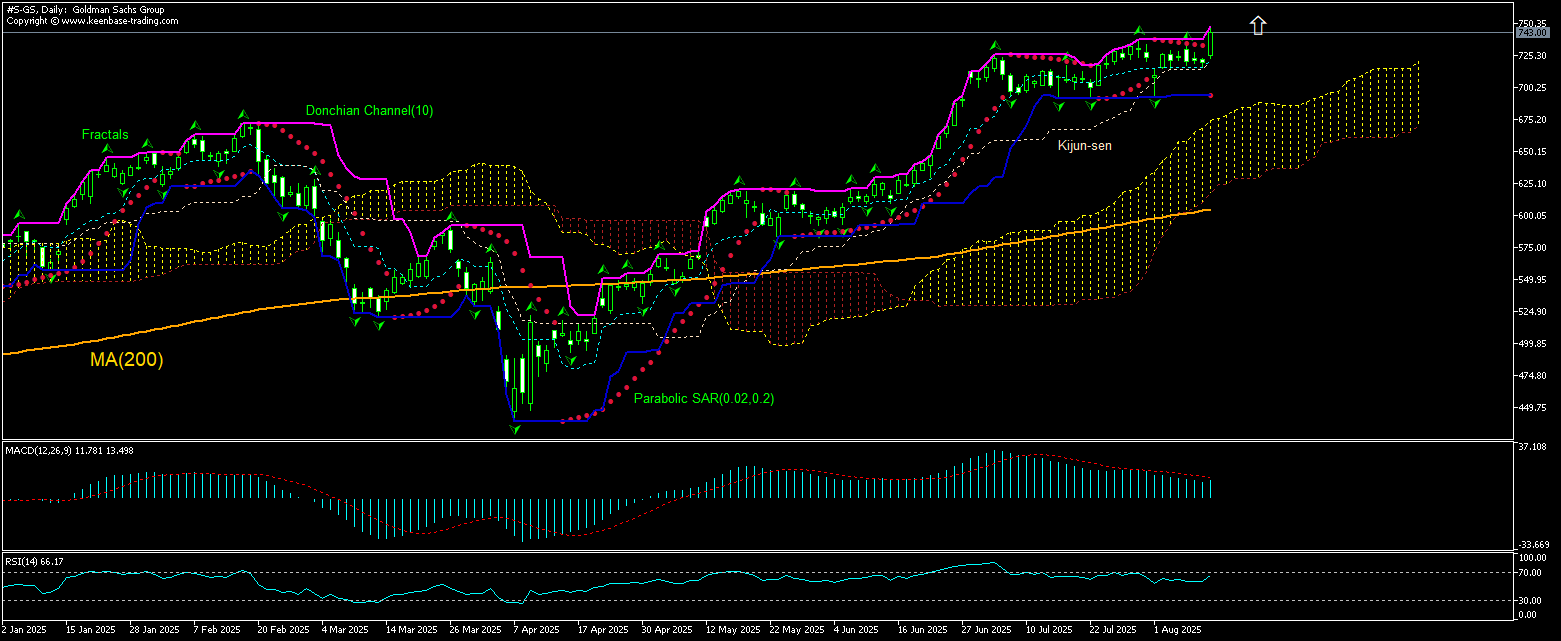
Goldman Sachs التحليل الفني - Goldman Sachs التداول: 2025-08-13
Goldman Sachs ملخص التحليل الفني
أعلى من 747.83
Buy Stop
أقل من 693.95
Stop Loss
| مؤشر | الإشارة |
| RSI | محايد |
| MACD | شراء |
| Donchian Channel | شراء |
| MA(200) | شراء |
| Fractals | محايد |
| Parabolic SAR | شراء |
| Ichimoku Kinko Hyo | شراء |
Goldman Sachs تحليل الرسم البياني
Goldman Sachs التحليل الفني
The technical analysis of the Goldman Sachs stock price chart on daily timeframe shows #S-GS, Daily is advancing above the 200-day moving average MA(200) after returning above MA(200) 8 weeks ago. We believe the bullish momentum will continue after the price breaches above the upper boundary of Donchian channel at 747.83. This level can be used as an entry point for placing a pending order to buy. The stop loss can be placed below 693.95. After placing the order, the stop loss is to be moved every day to the next fractal high, following Parabolic indicator signals. Thus, we are changing the expected profit/loss ratio to the breakeven point. If the price meets the stop loss level (693.95) without reaching the order (747.83), we recommend cancelling the order: the market has undergone internal changes which were not taken into account.
التحليل الأساسي لـ الأسهم - Goldman Sachs
Goldman Sachs stock rose after the bank said it is raising its dividend. Will the Goldman Sachs stock price continue advancing?
The Goldman Sachs Group, Inc. is a global investment bank and financial services company with market capitalization at $225.0 billion. The company is active in four primary segments: Global Banking & Markets, Asset & Wealth Management, and Platform Solutions. The stock is trading at P/E ratio (Trailing Twelve Months) of 16.37 and Price/Sales ratio of 4.31 currently. The company earned $54.79 billion revenue (ttm), operated at Operating Margin (ttm) of 35.73% and earned a Return on Equity (ttm) of 12.74% . The bank announced it will increase its dividend from last year's comparable payment on the 29th of September to $4.00. This takes the annual payment to 2.2% of the current stock price, which is about average for the industry. The bank's distributions have been remarkably stable over its long history of paying dividends. The dividend has gone from an annual total of $2.40 in 2015 to the most recent total annual payment of $16.00. This means that it has been growing its distributions at 21% per annum over that time. There has been strong dividend growth and there haven't been any cuts for a long time. With earnings growing rapidly and a low payout ratio the company is a great dividend stock. One has just to take into account that the dividend payment sustainability is not 100 guaranteed since while Goldman Sachs has a low payout ratio the bank’s free cash flows weren't positive based on the last payment. The increase in Goldman Sachs’ dividend is bullish for Goldman Sachs stock price.
استكشف
شروط التداول لدينا
- فروق الأسعار من 0.0 نقطة
- أكثر من 30,000 أداة تداول
- التنفيذ الفوري
هل أنت مستعد للتداول؟
فتح حساب :تنبيه
يحمل هذا الموجز طابعاً إعلامياً و تعليمياً و تنشر بالمجان . تأتي معظم البيانات المدرجة في الموجز من المصادر العامة معترفة أكثر و أقل موثوقية . مع ذلك ، لا يوجد تأكيد على أن المعلومات المشارة إليها كاملة و دقيقة . لا يتم تحديث الموجز . معظم المعلومات في كل موجز ، تتضمن الرأي و المؤشرات و الرسوم البيانية و أي شيئ اخر وتقدم فقط لأغراض التعريف وليس المشورة المالية أو توصية . لا يمكن اعتبار النص باكماله أو أي جزء منه و أيضاً الرسوم البيانية كعرض لقيام بصفقة بأي اداة . آي إف سي ماركيتس وموظفيها ليست مسؤولة تحت أي ظرف من الظروف عن أي إجراء يتم اتخاذه من قبل شخص آخر أثناء أو بعد قراءة نظرة عامة .


